Getting started
HOLMES runs as a local web application. This guide covers every feature of the interface, step by step; the common workflows page chains them into complete modeling exercises.
Installation and launch
Install HOLMES (Python ≥ 3.12) and start the server:
Your browser opens on http://127.0.0.1:8000 by itself; open that address manually if it does not.
On the first launch the server downloads the prebuilt dataset — one archive from the repository's data release — so starting can take a few minutes; the terminal shows the download progress, and the application starts as soon as it finishes.
Afterwards it only re-downloads when a newer archive is published, and keeps serving the current data in the meantime.
No credentials are needed to run the application.
The data lives in the per-user data directory (~/.local/share/holmes on Linux, ~/Library/Application Support/holmes on macOS, %LOCALAPPDATA%\holmes\holmes on Windows); set the HOLMES_DATA_DIR environment variable to use another location, and HOLMES_SKIP_DATA_SYNC=True to skip the startup check entirely.
The interface
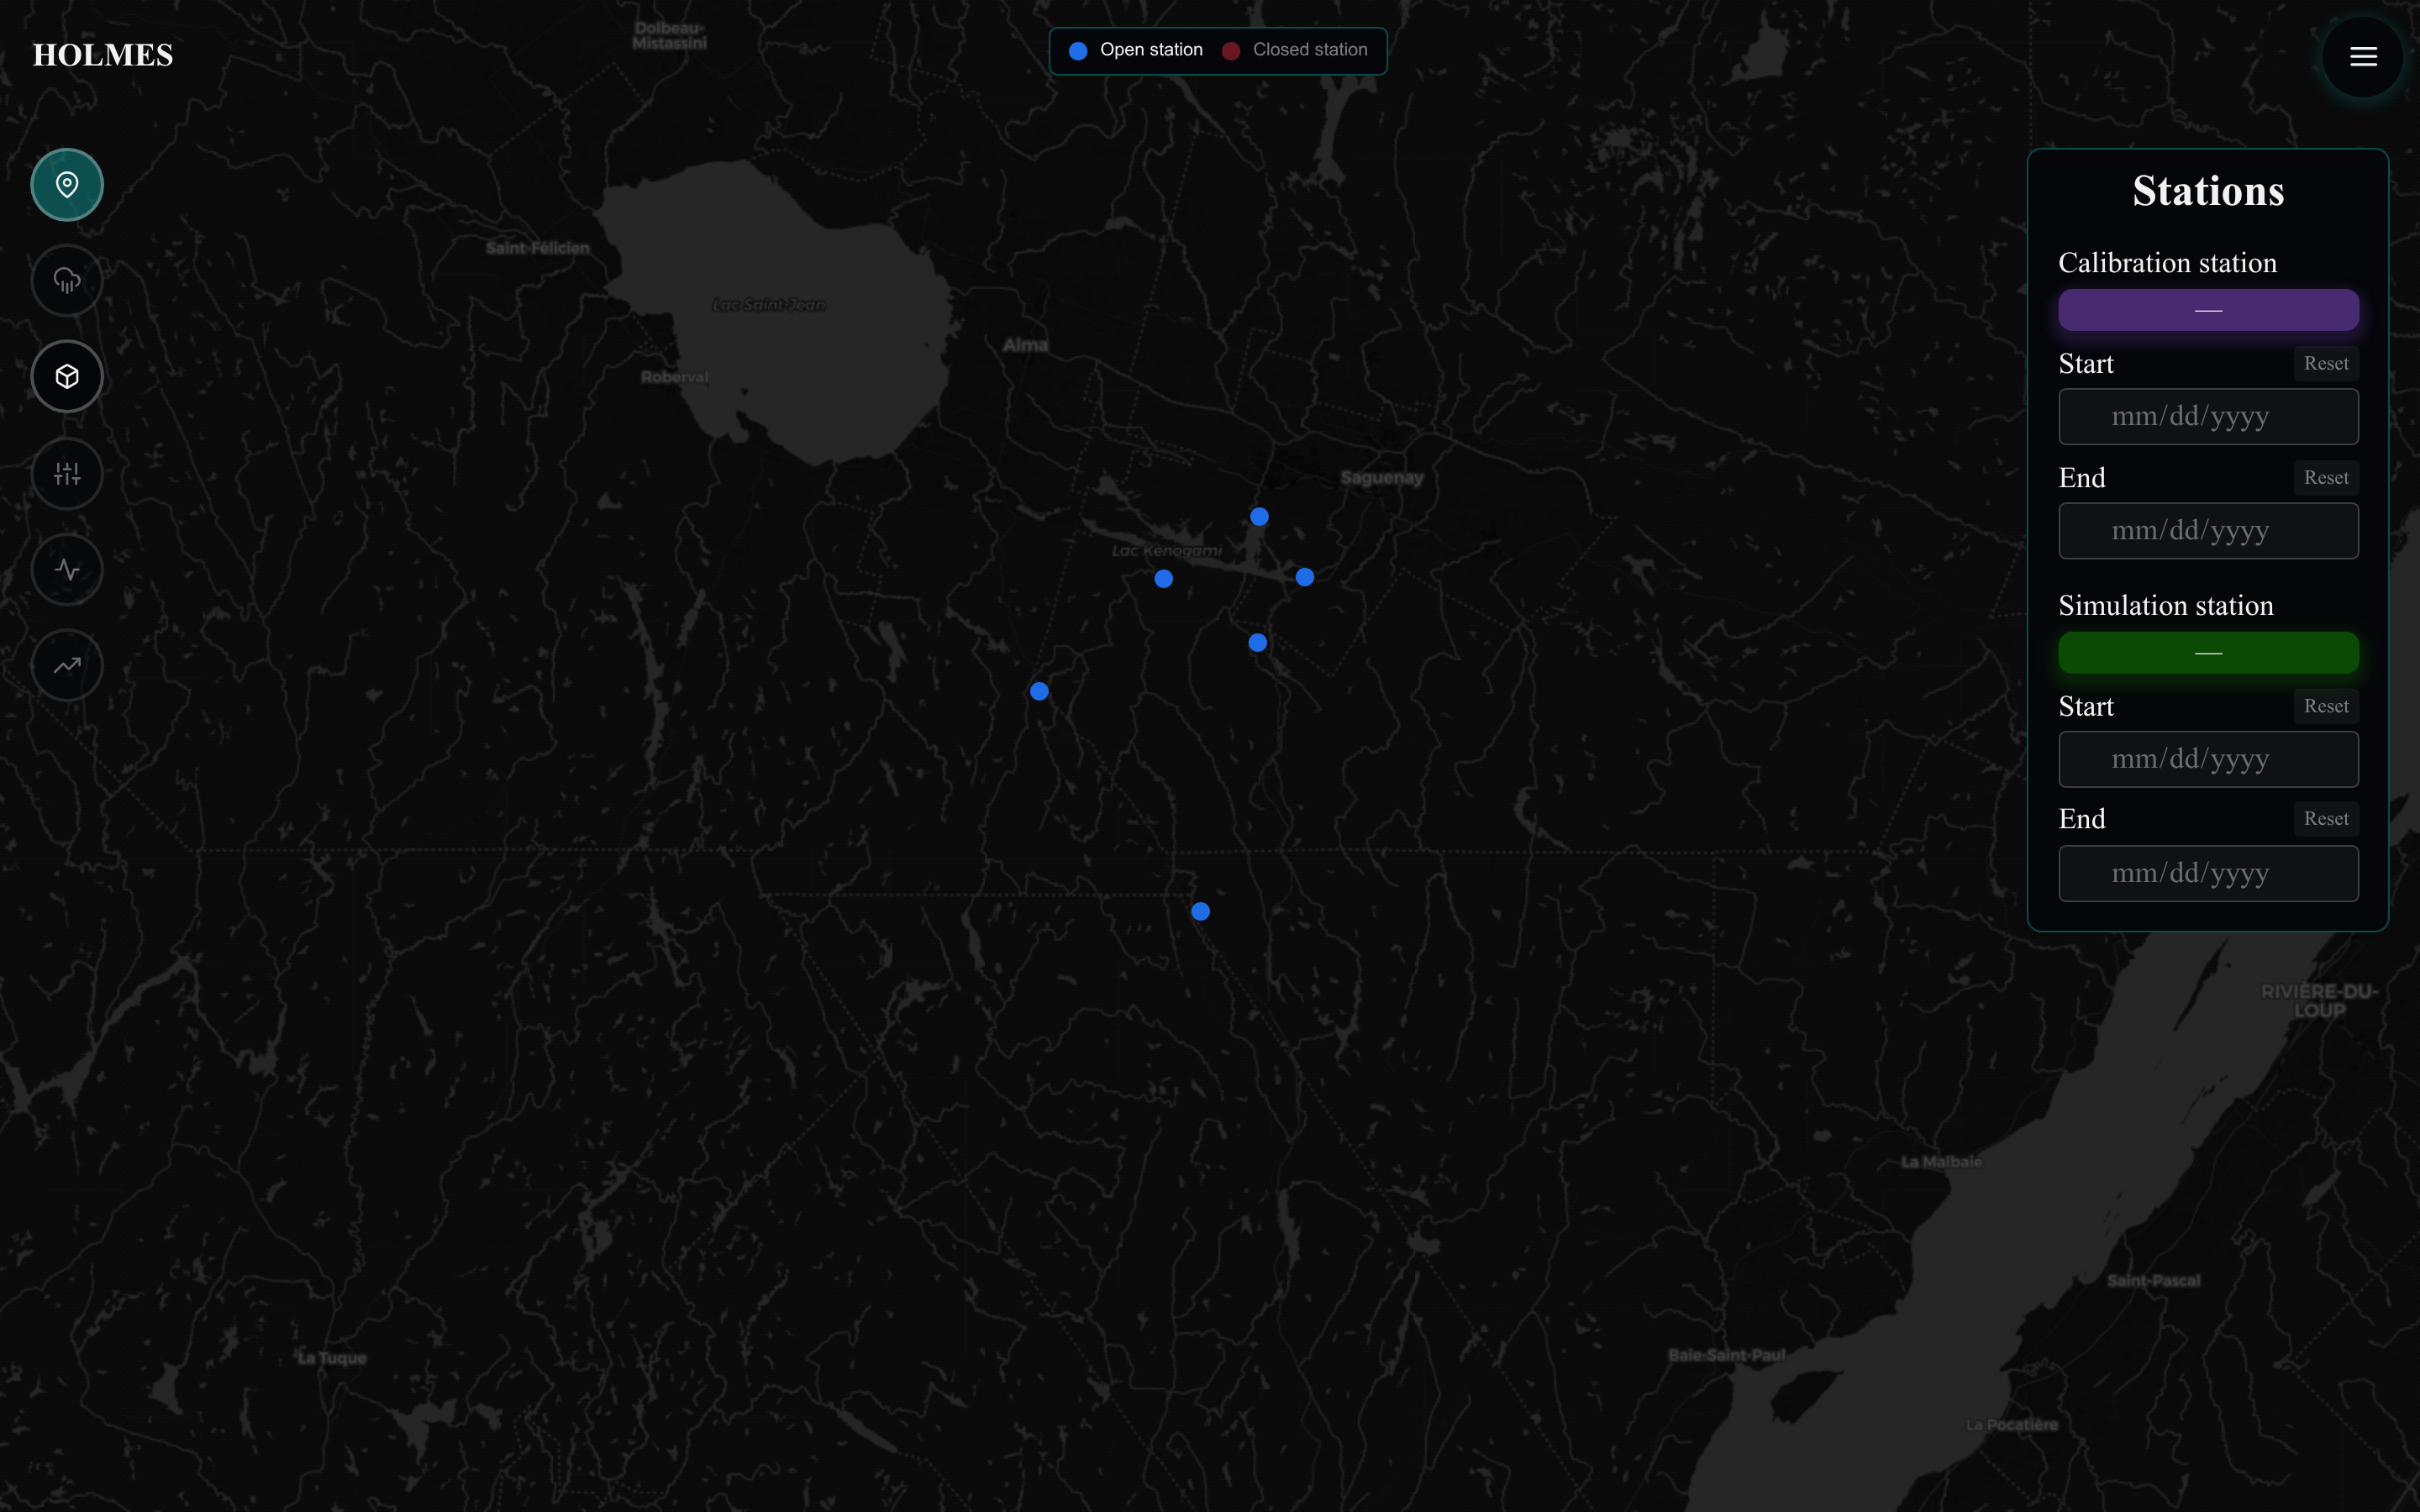
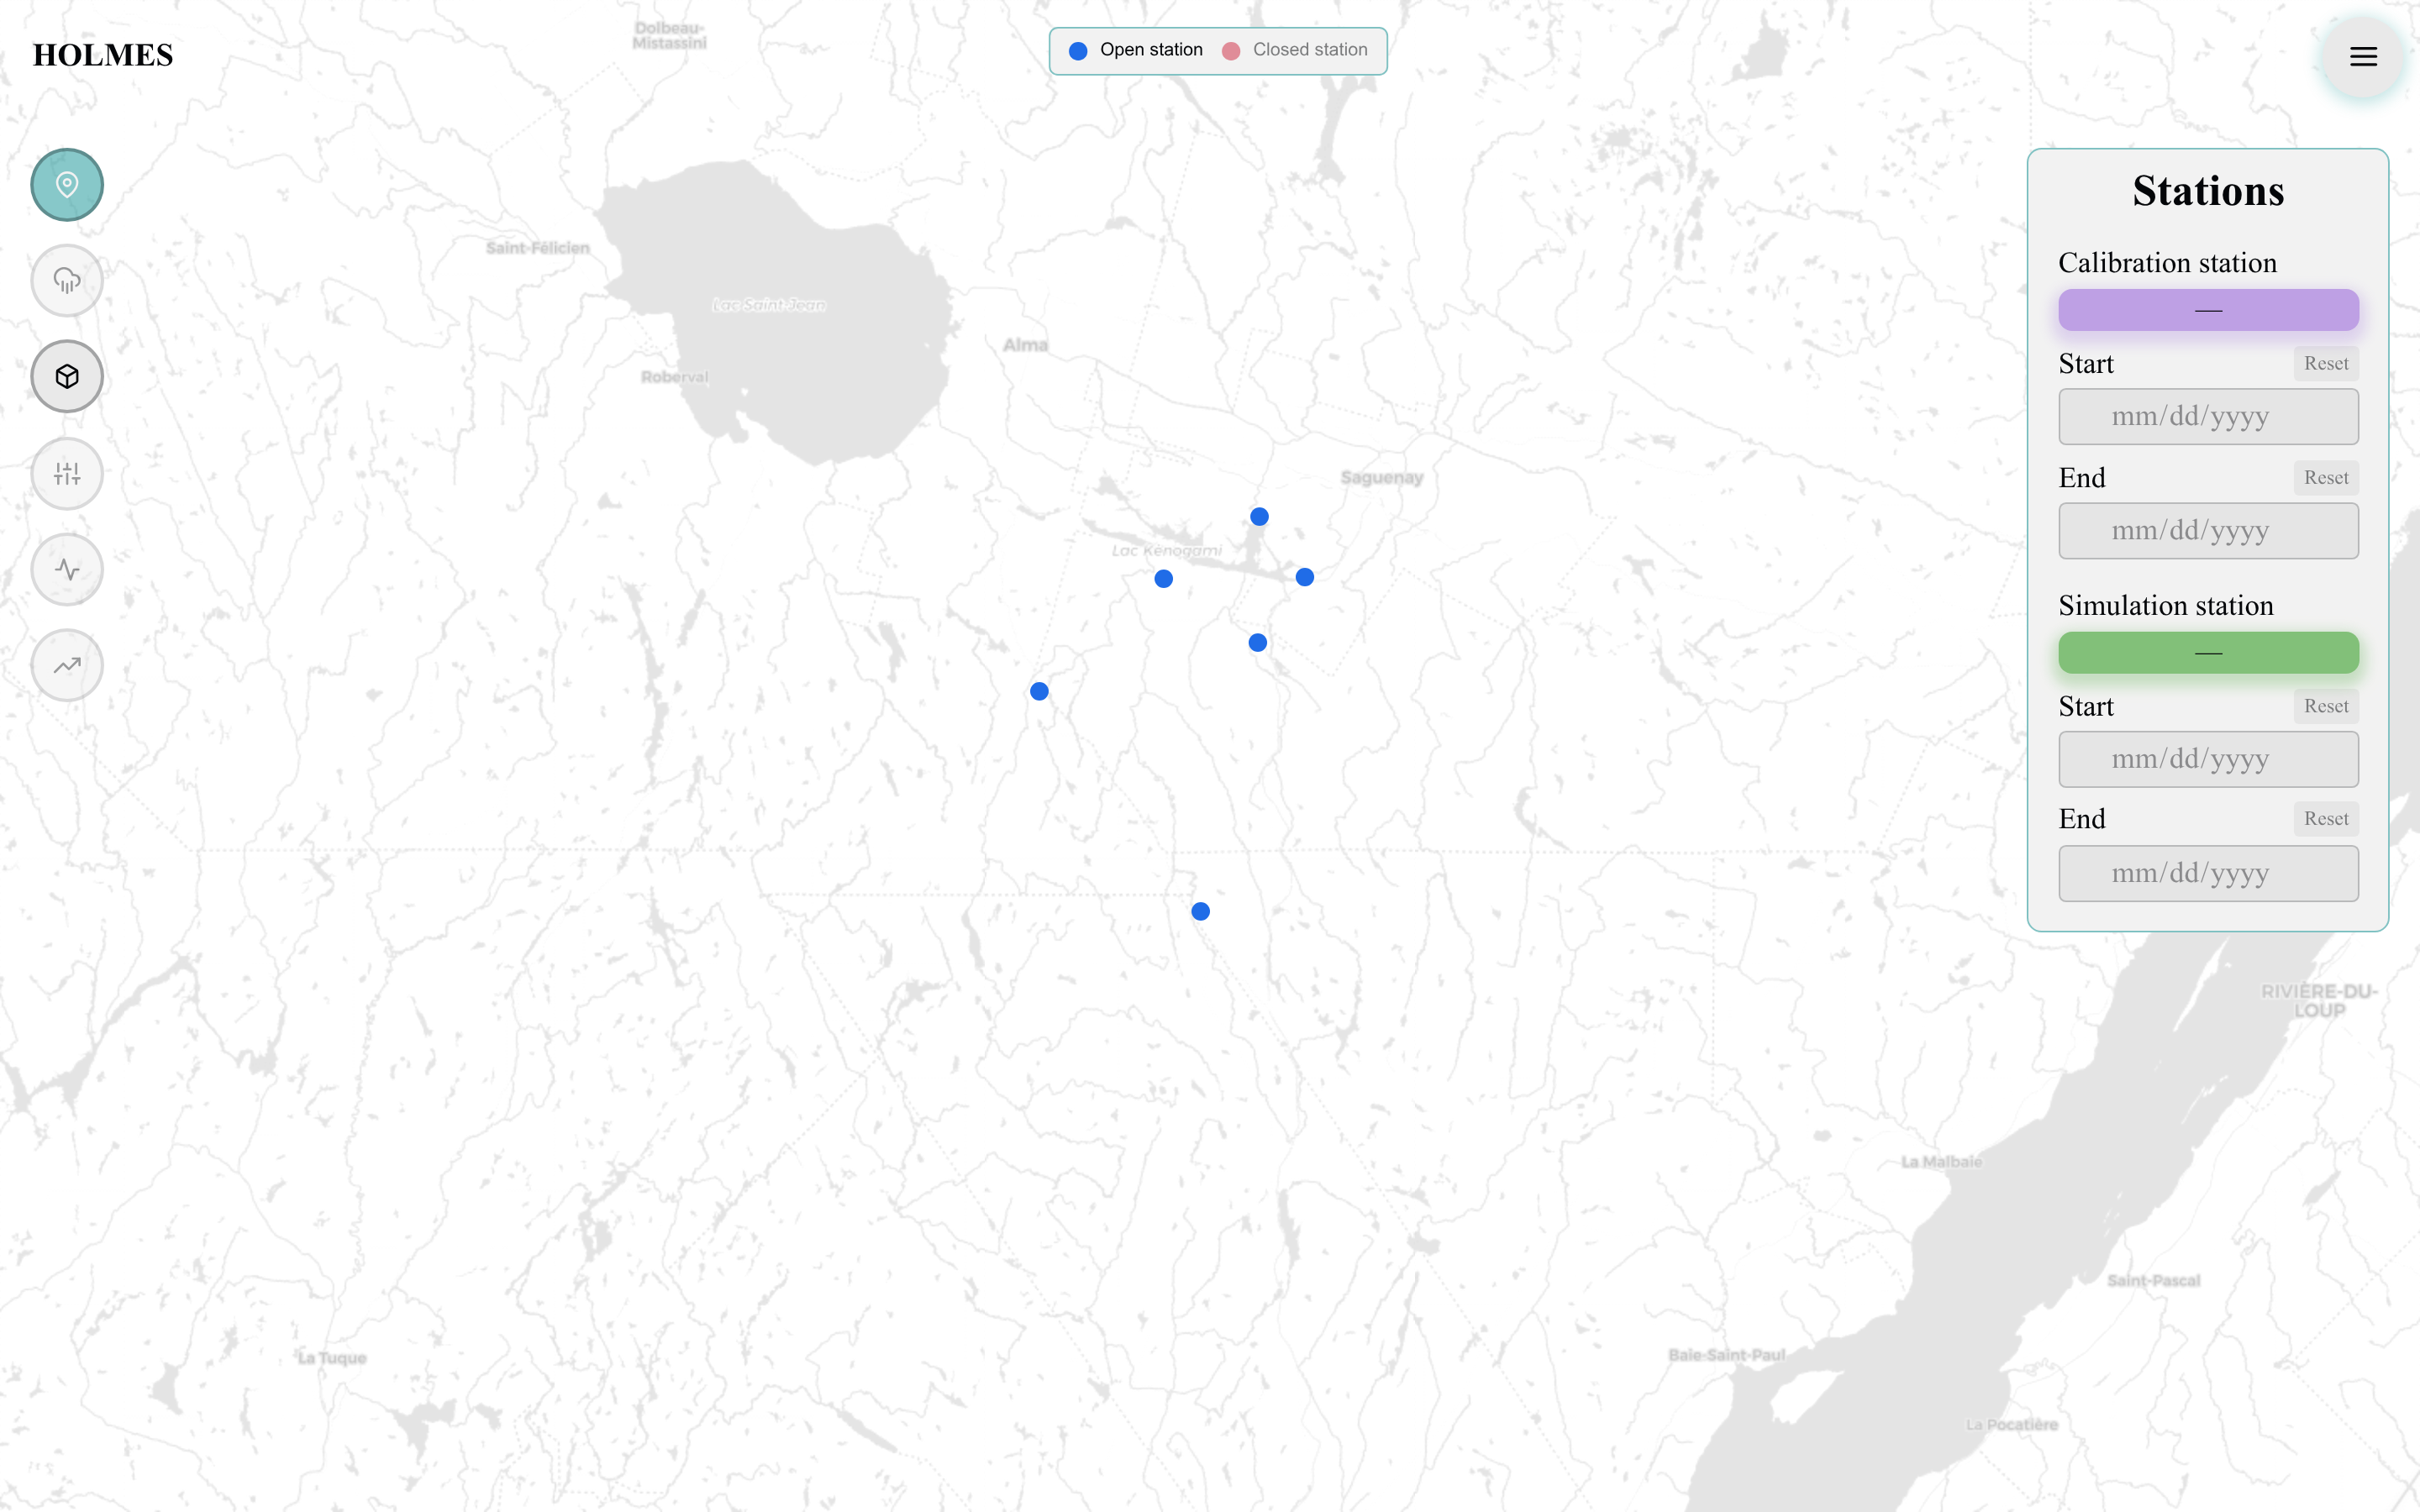
The screen is divided into four regions:
- Sidebar (left): the six pipeline steps as circular buttons — Stations, Weather, Model, Calibration, Simulation, Projection.
- Controls (top right): the settings card of the current step.
- Canvas (center): the charts — or, for the Model step, the model catalog.
- Map (background): the interactive station map, visible on the Stations and Weather steps.
The menu button in the top-right corner opens the settings panel:


- "Toggle theme" switches between the dark (default) and light themes; the T key does the same anywhere outside a text field.
- "Reset all" erases everything the application has saved in your browser and reloads — a full factory reset of the pipeline.
- Version shows the installed HOLMES version.
The pipeline
HOLMES is organized as a linear pipeline: each step consumes choices made in the previous ones. The sidebar shows where you are and what state each step is in:


- Locked (dimmed): the step is missing an upstream choice — for example, Weather stays locked until both stations and both periods are set.
- Available (grey ring): the step can be opened but is not configured yet.
- Done (green ring): the step's choices are complete and its results are current.
- Stale (yellow ring): something upstream changed since the step last completed; revisit it to recompute.
- The current step is highlighted.
Changing anything that affects a calibration — station, period, weather method, transformation, warmup, models, snow model — discards the calibrated parameters and re-locks Simulation and Projection until you recalibrate. This is deliberate: downstream results must never silently reflect an outdated configuration.
Your selections persist in the browser (they survive a reload), but calibration results worth keeping longer should be exported to a file.
Working with charts
Every chart in HOLMES shares the same interactions:
- Zoom: click and drag horizontally to select a time range; the chart zooms to it.
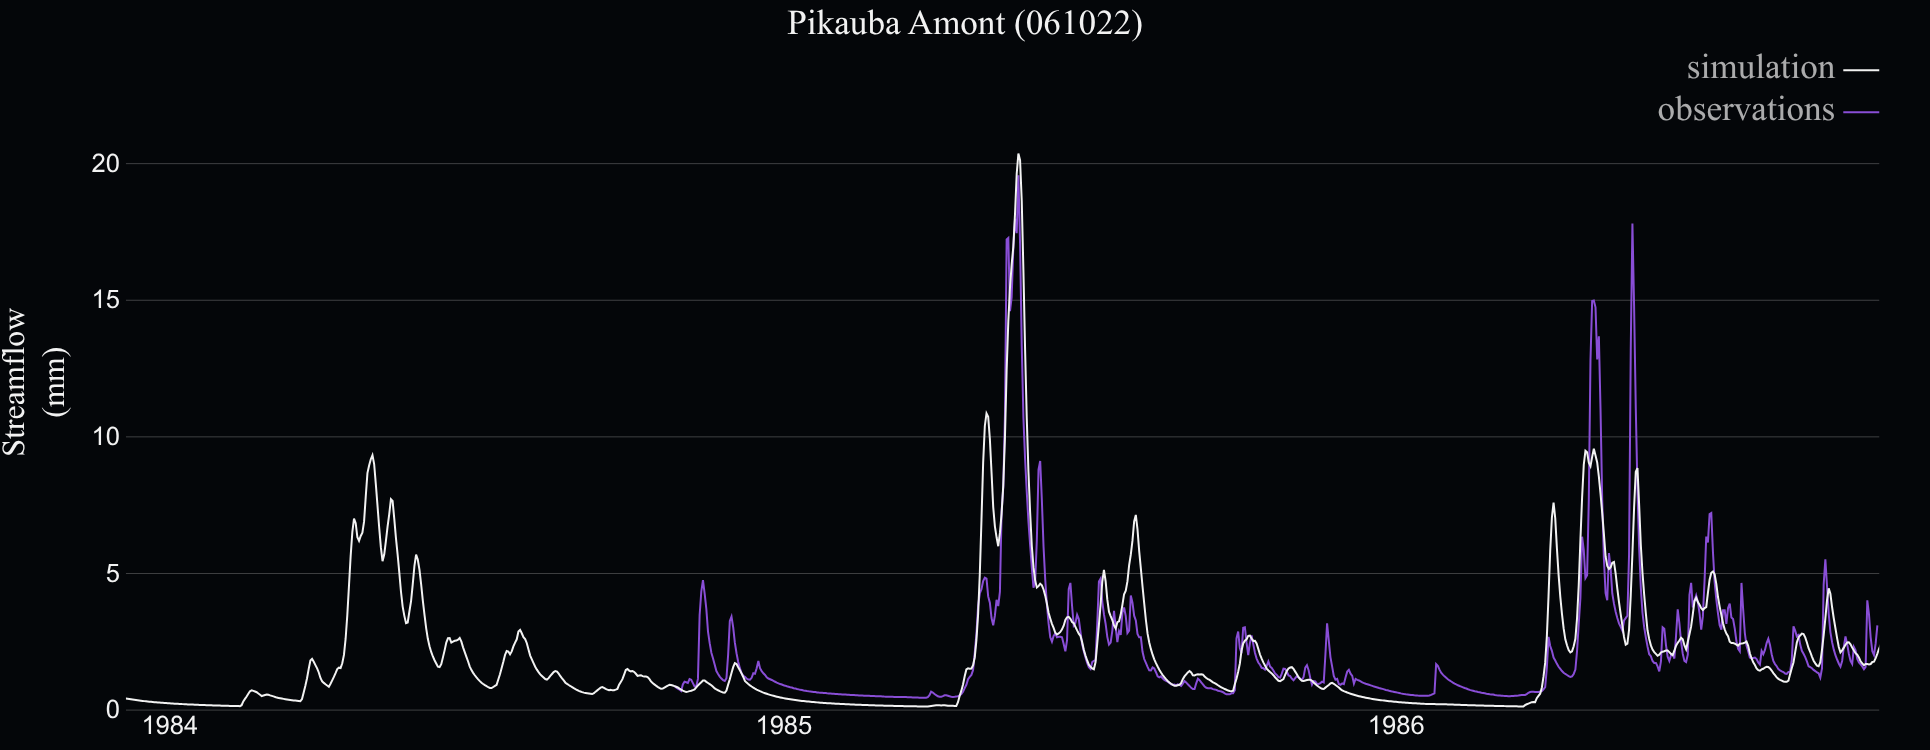
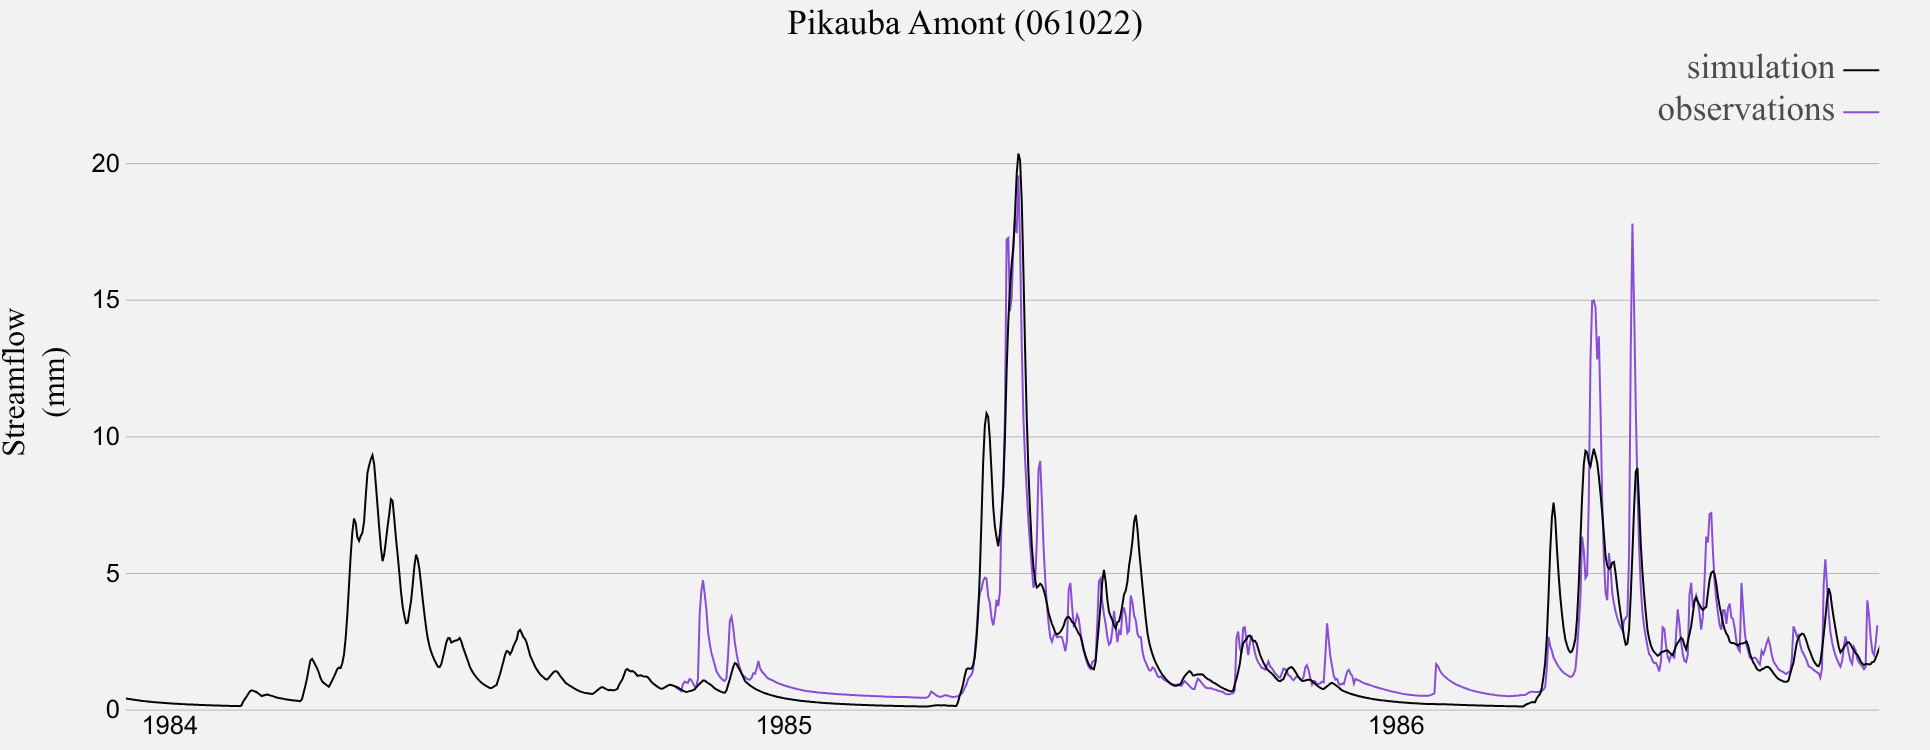
- Reset: double-click the chart to restore the full range.
- Highlight: on steps with several models, hovering a model's row in the controls card highlights its line in the charts and dims the others.
- Missing data appear as faint red vertical bands; gaps break the line rather than being bridged.
While any data is loading, the browser-tab icon switches to a spinner and the affected charts show their own loading indicator.