Projection
The Projection step drives the calibrated models with climate-model ensembles instead of past weather, projecting the simulation station's flow regime over the coming decades (2020–2099). Like Simulation, it unlocks once calibration has produced parameters and computes automatically when opened.
Controls
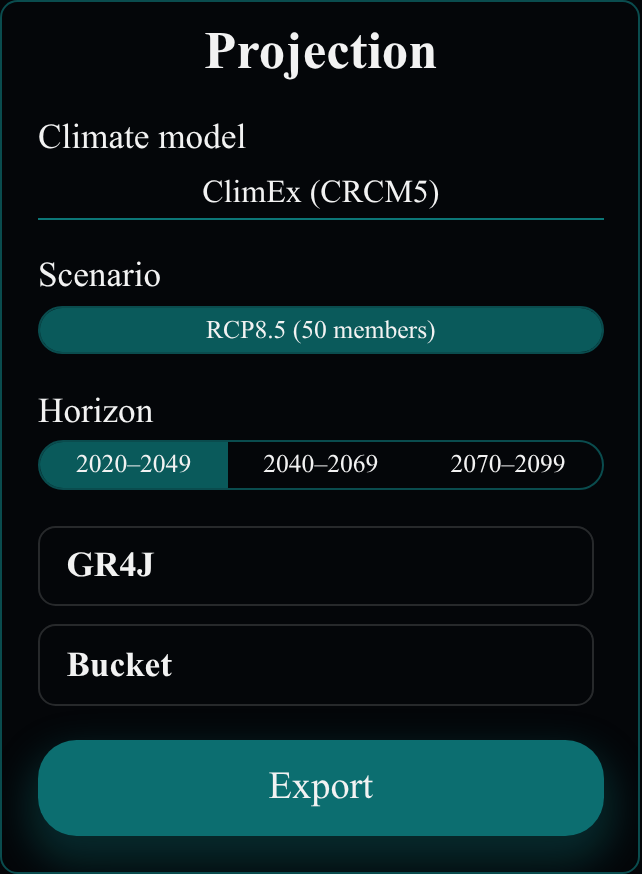
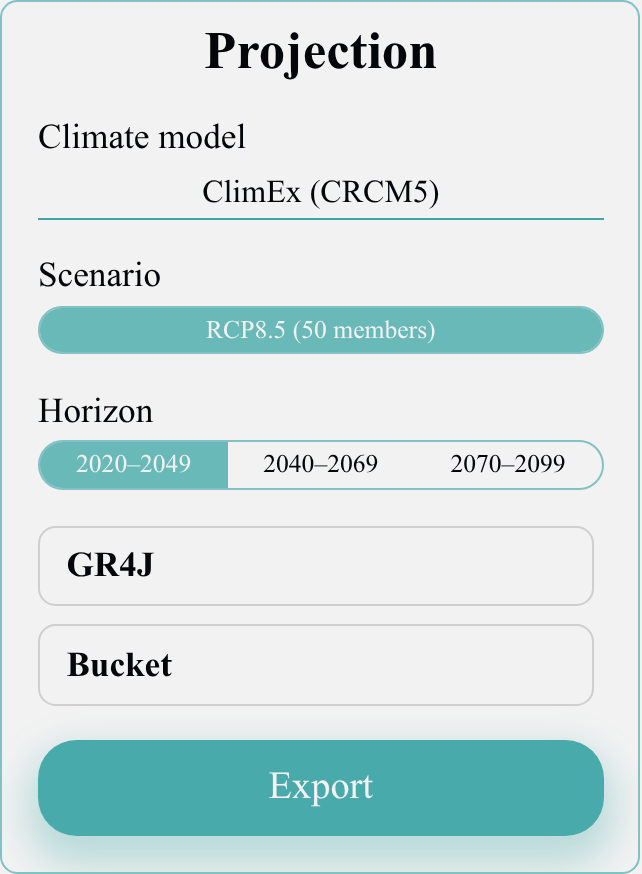
- "Climate model" — the forcing ensemble: "ClimEx (CRCM5)", a 50-member single-model ensemble whose spread reflects natural climate variability; or "ESPO-G6-R2 (CMIP6)", a multi-model bias-adjusted CMIP6 ensemble whose spread also reflects model disagreement.
- "Scenario" — the emission pathway; ClimEx offers RCP8.5, ESPO-G6-R2 offers SSP2-4.5 and SSP3-7.0. Each button shows the member count.
- "Horizon" — the 30-year window: 2020–2049, 2040–2069 or 2070–2099.
- One row per hydrological model; hovering highlights it in the charts (no metric chip — there are no observations in the future to score against).
- "Export" — three files named
projection_<station>_<climate model>_<scenario>_<horizon>: a.json(configuration, parameters, median indicators), a_regime.csv(day-of-year regime per model) and an_indicators.csv(one row per model and member).
Switching any of the three settings refetches and redraws:
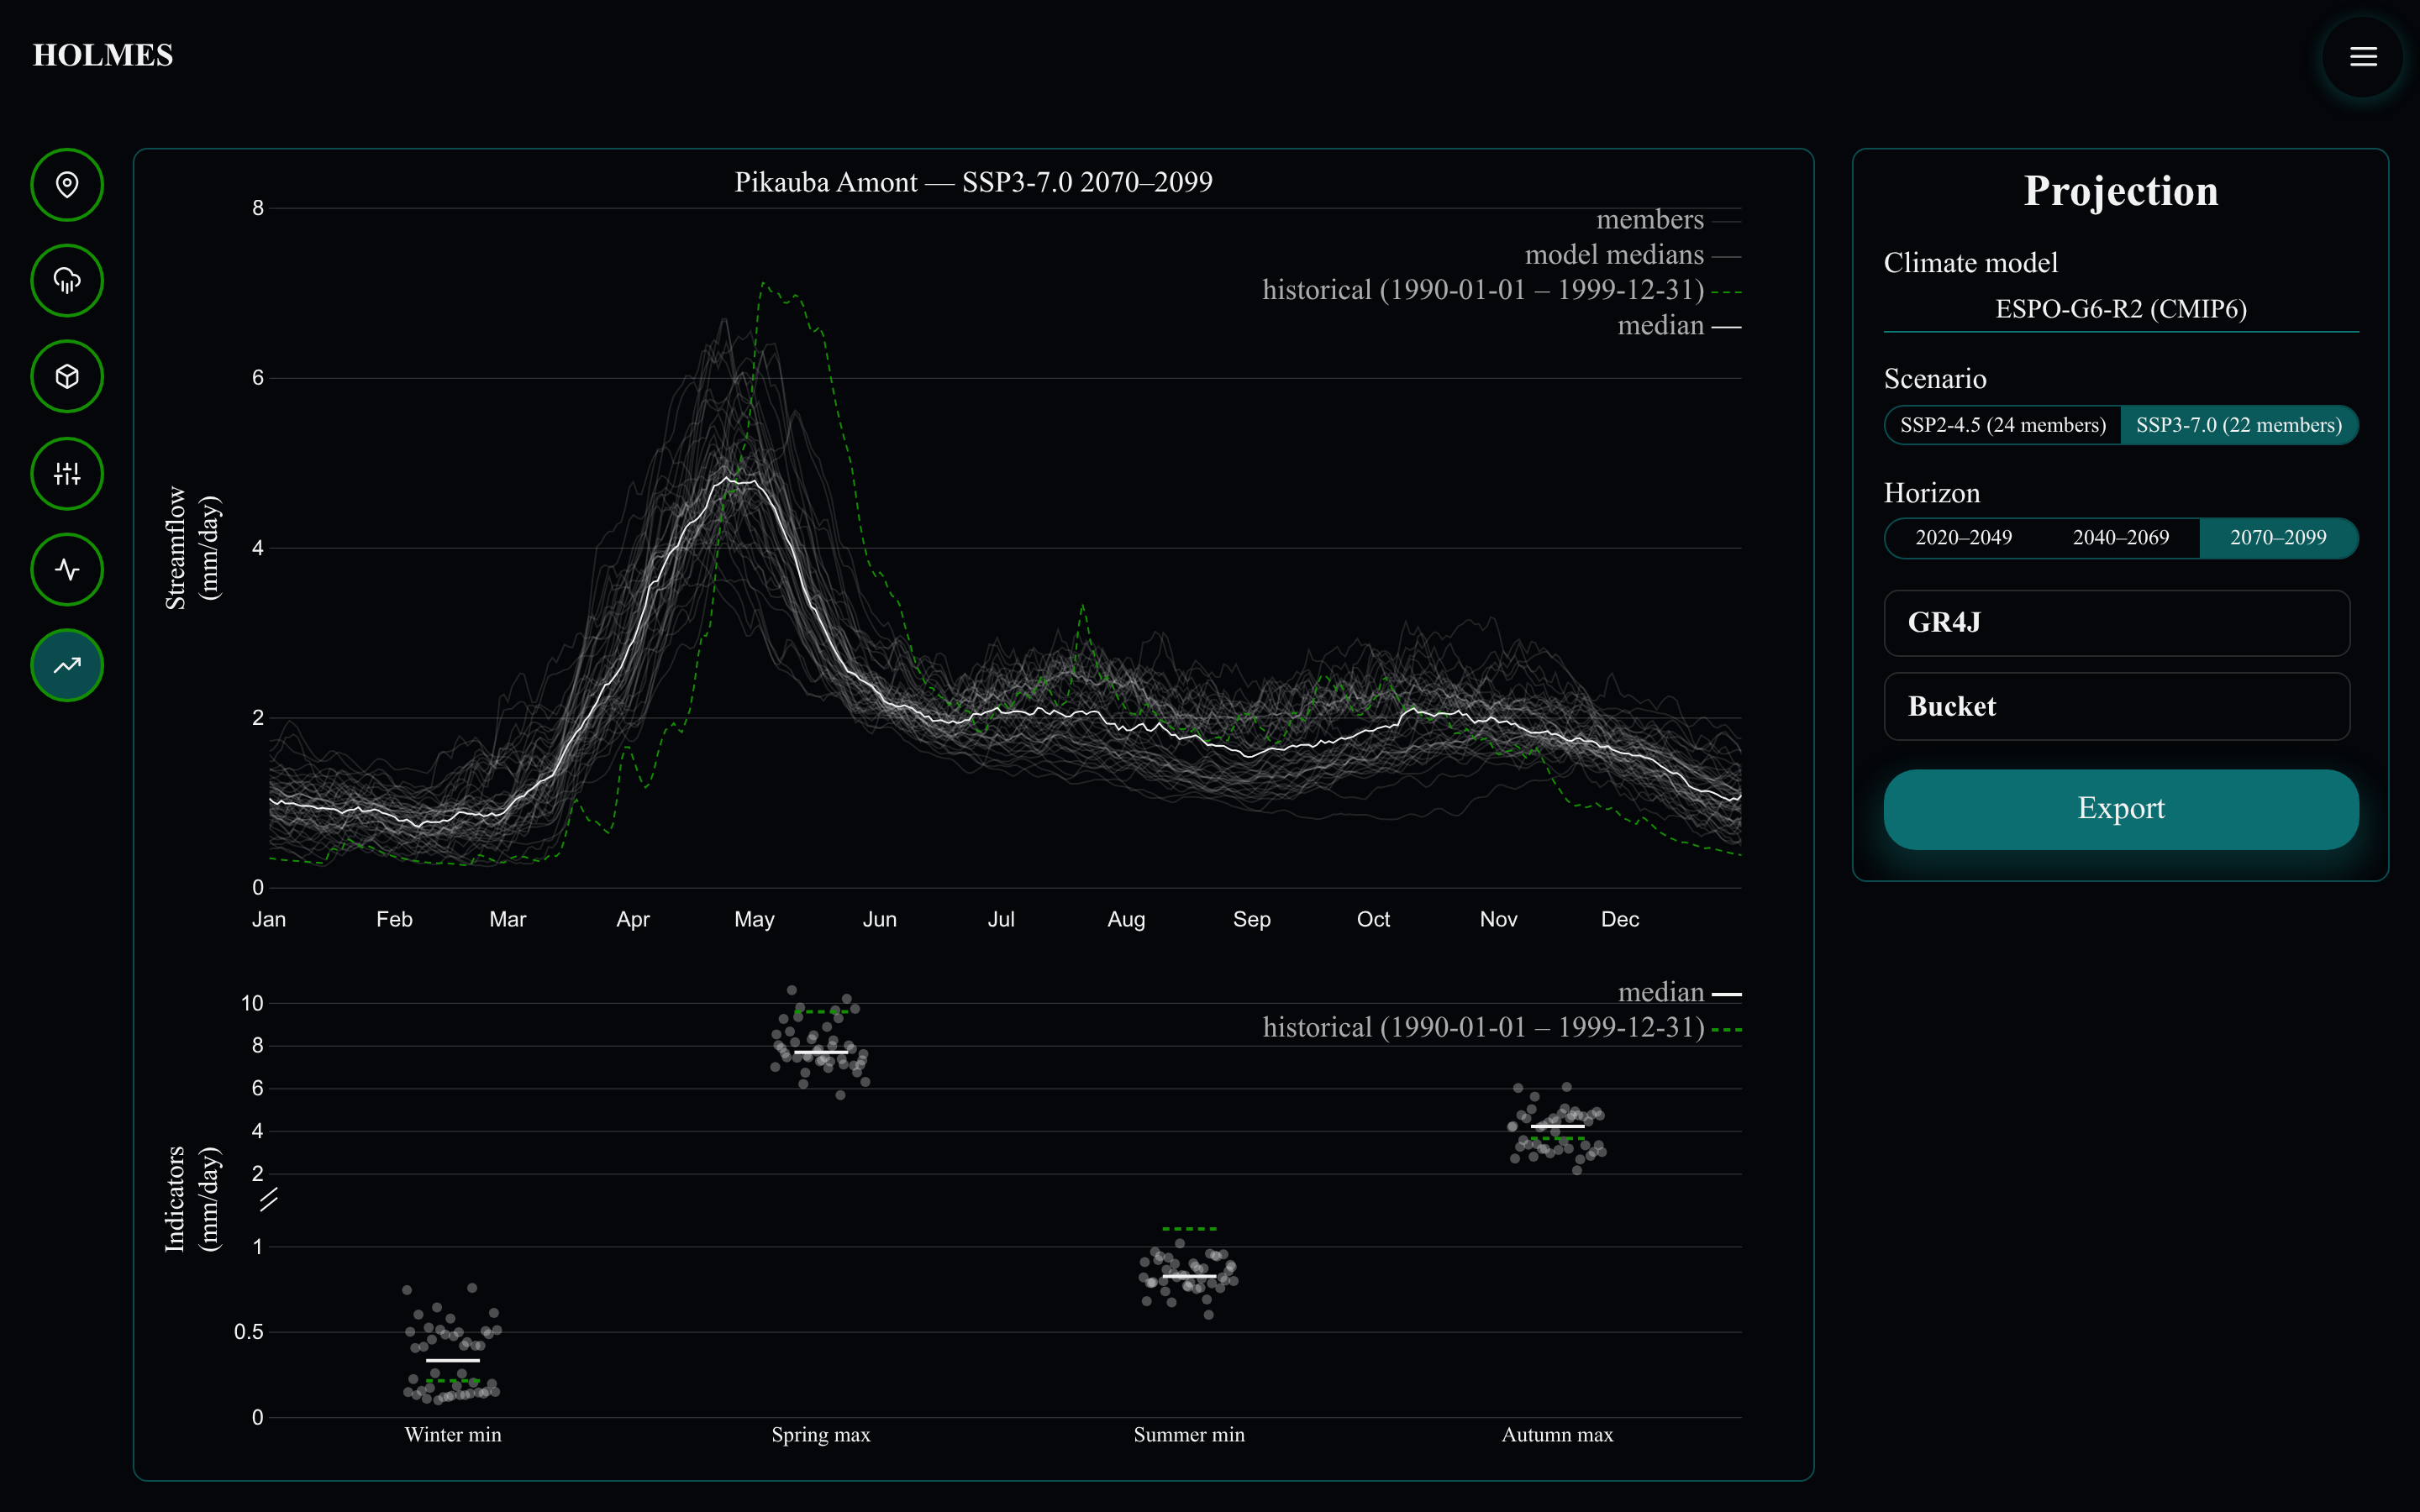
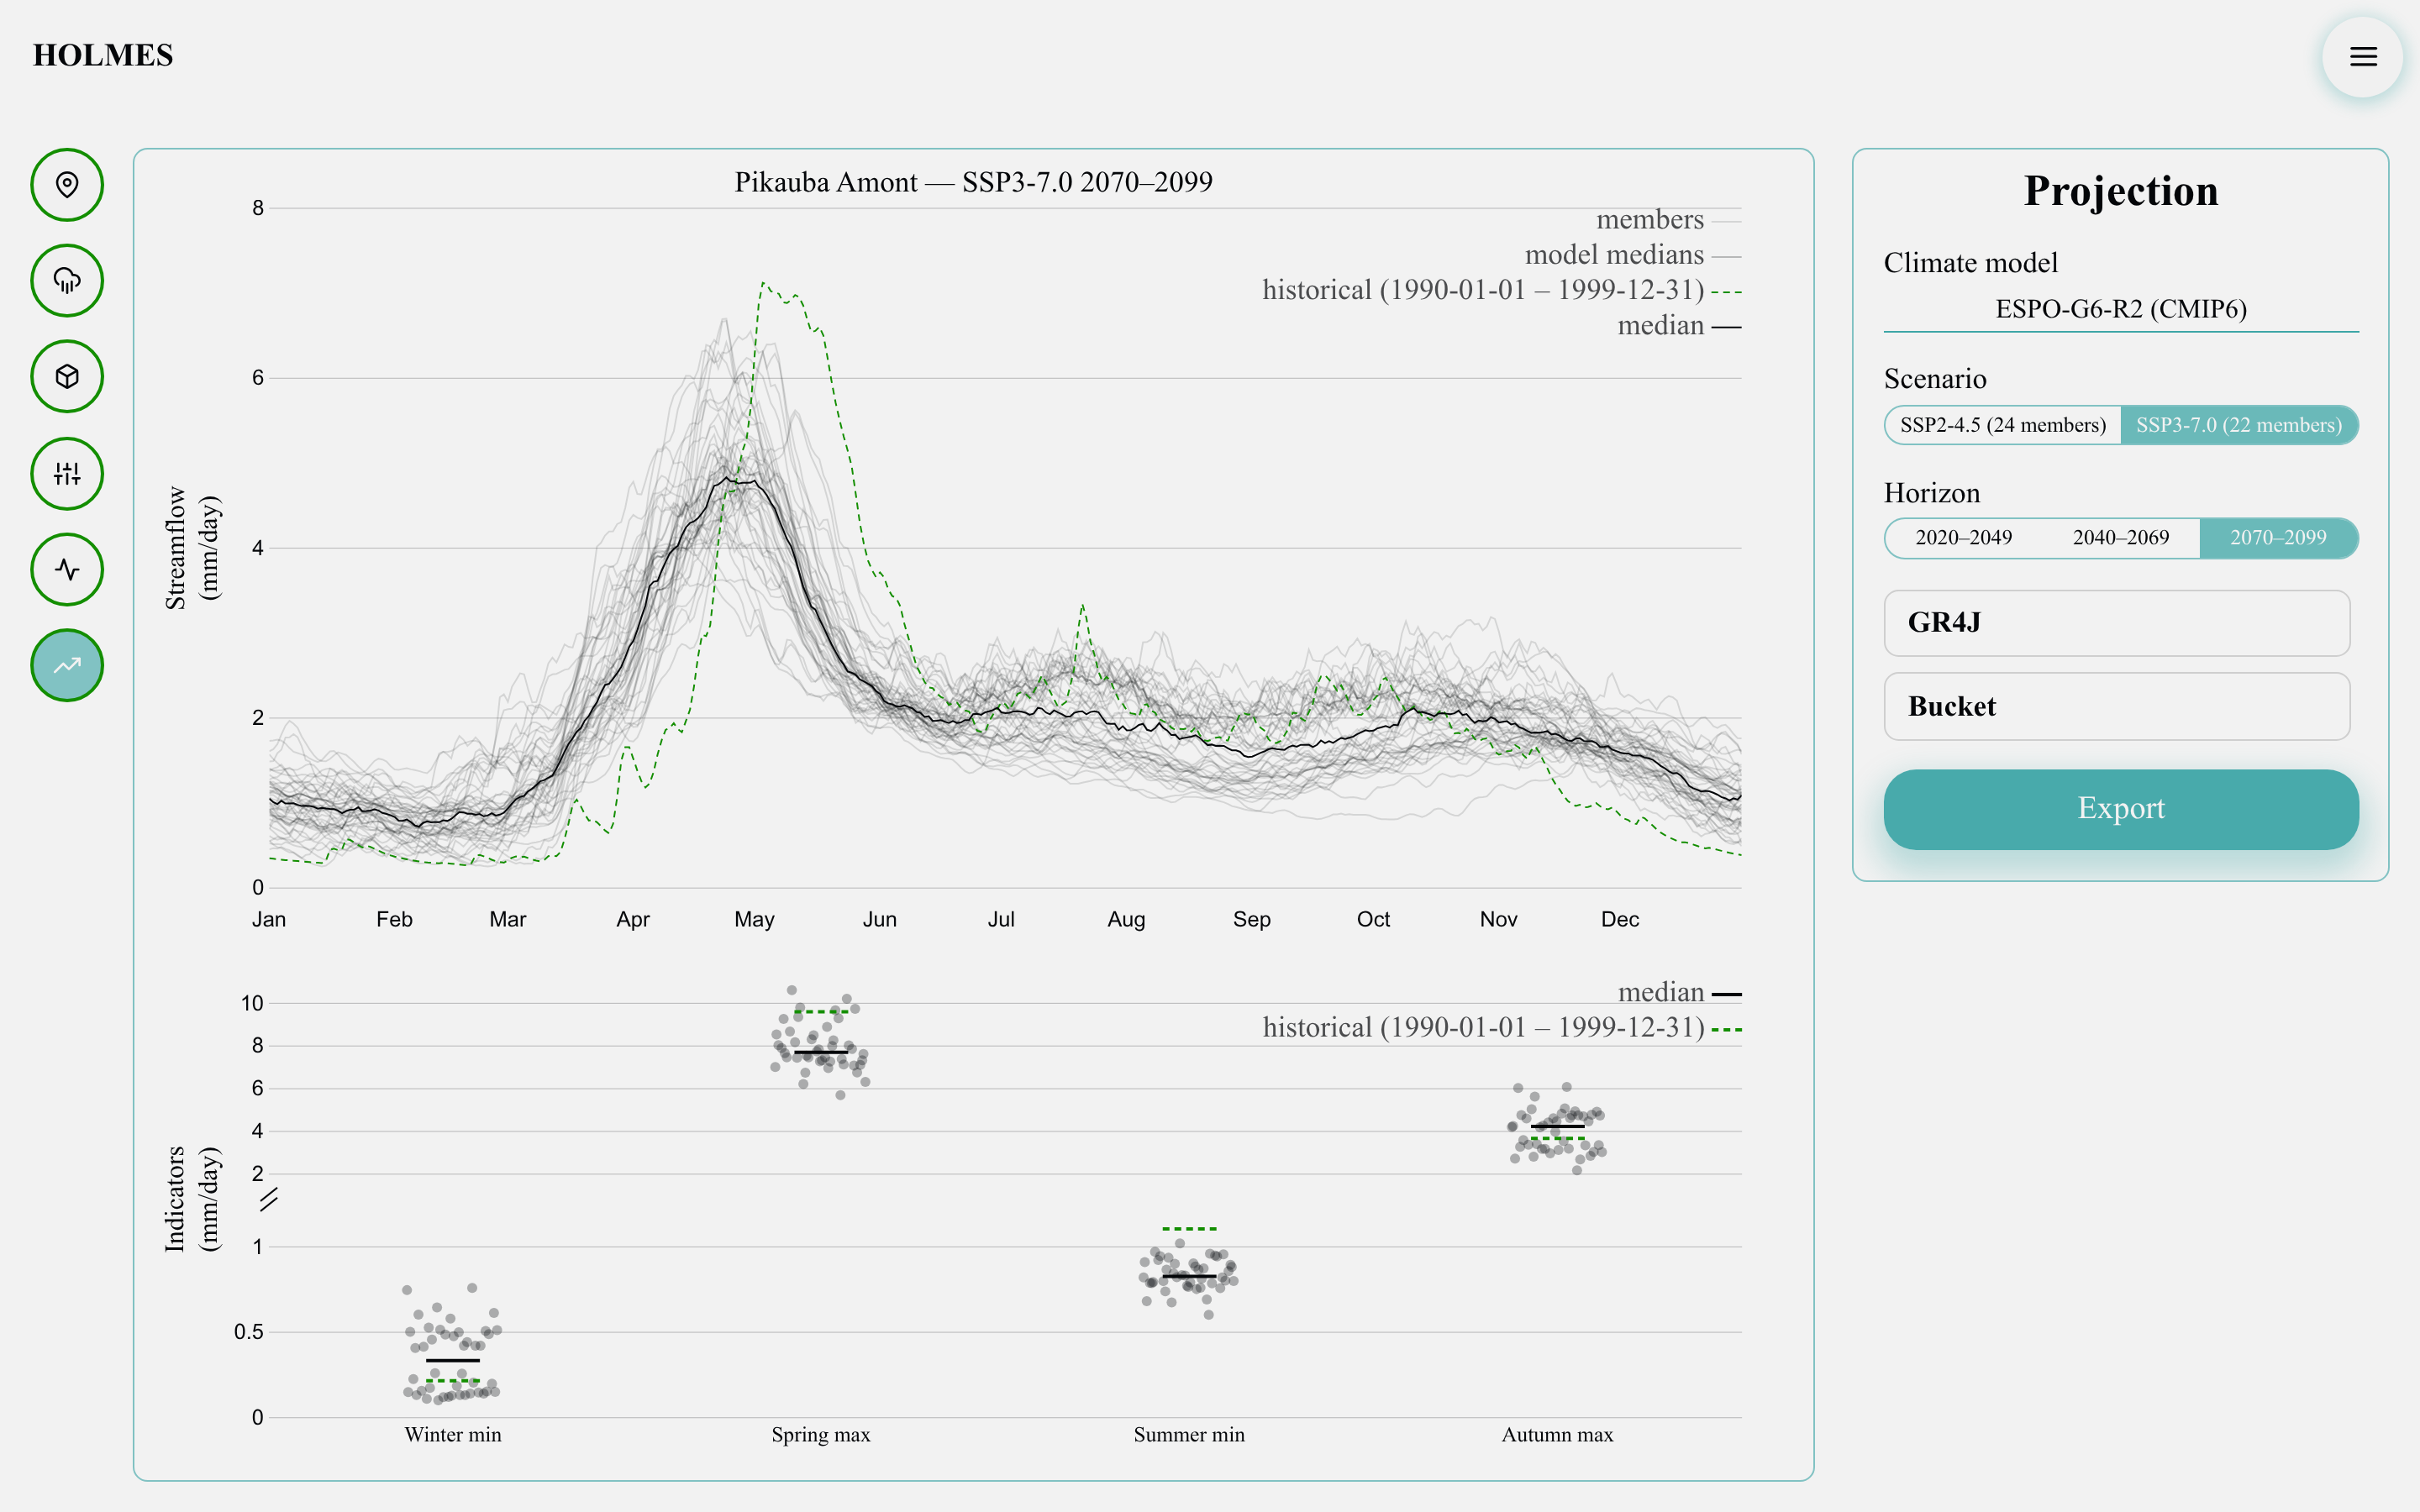
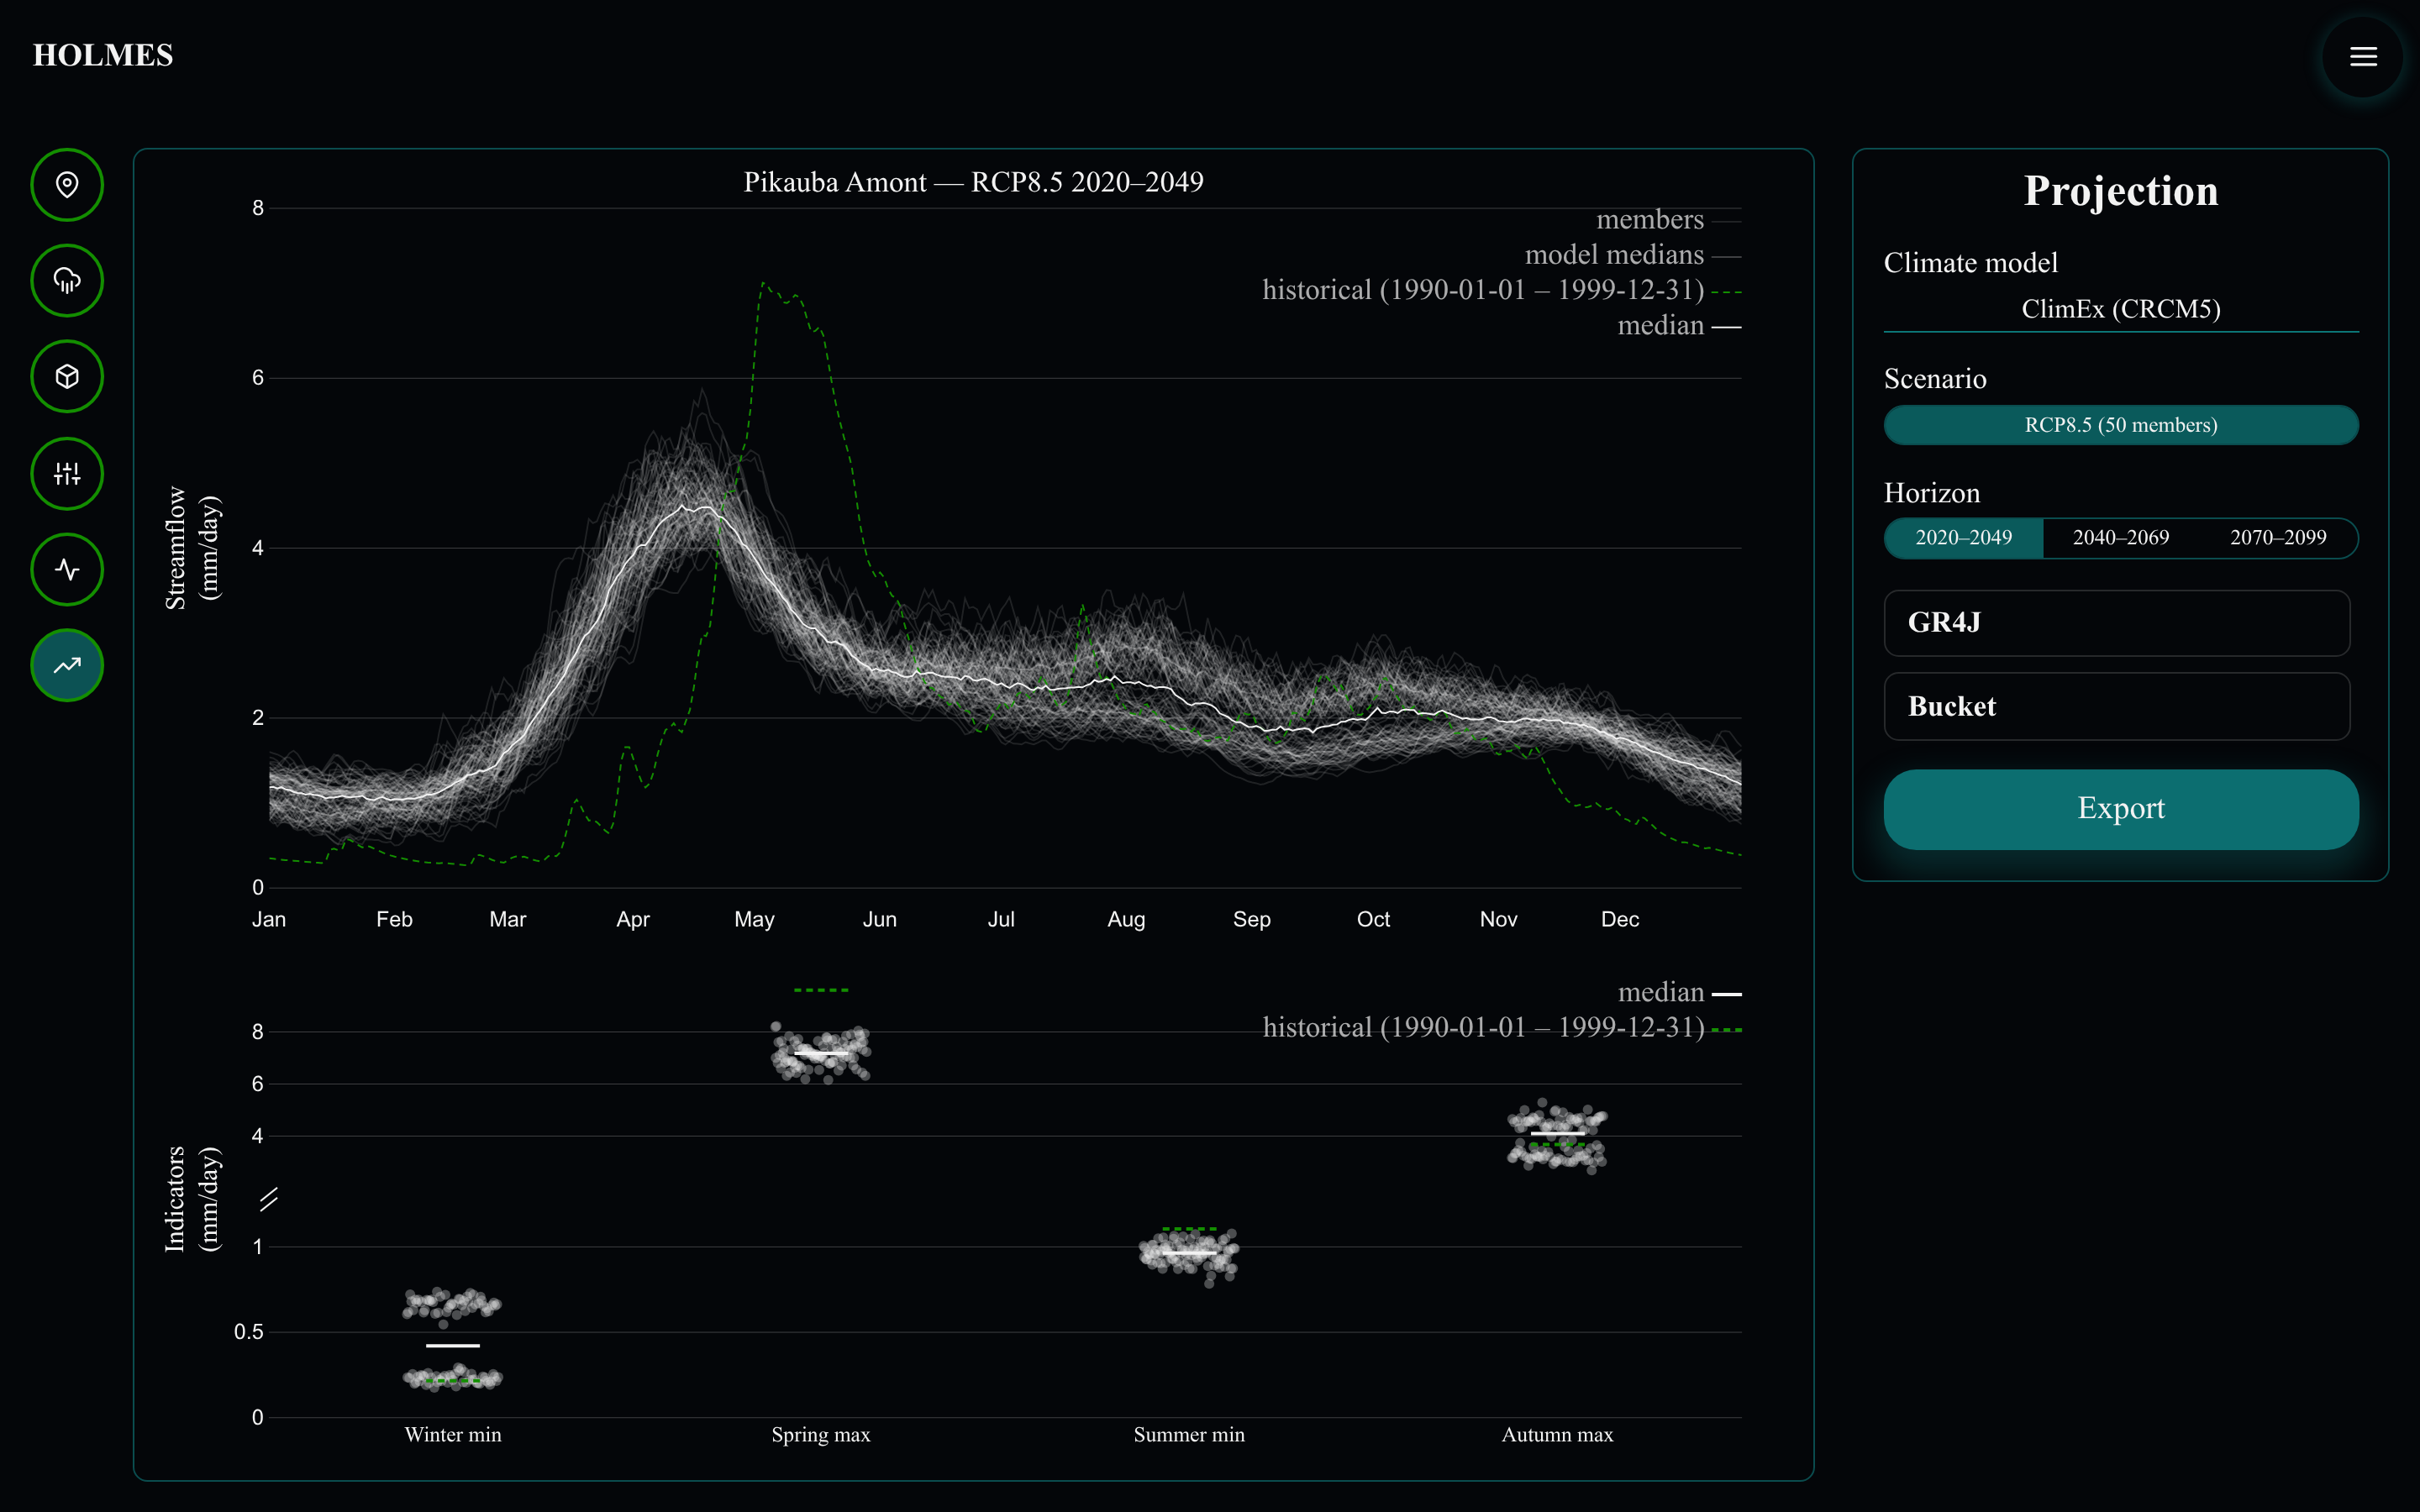
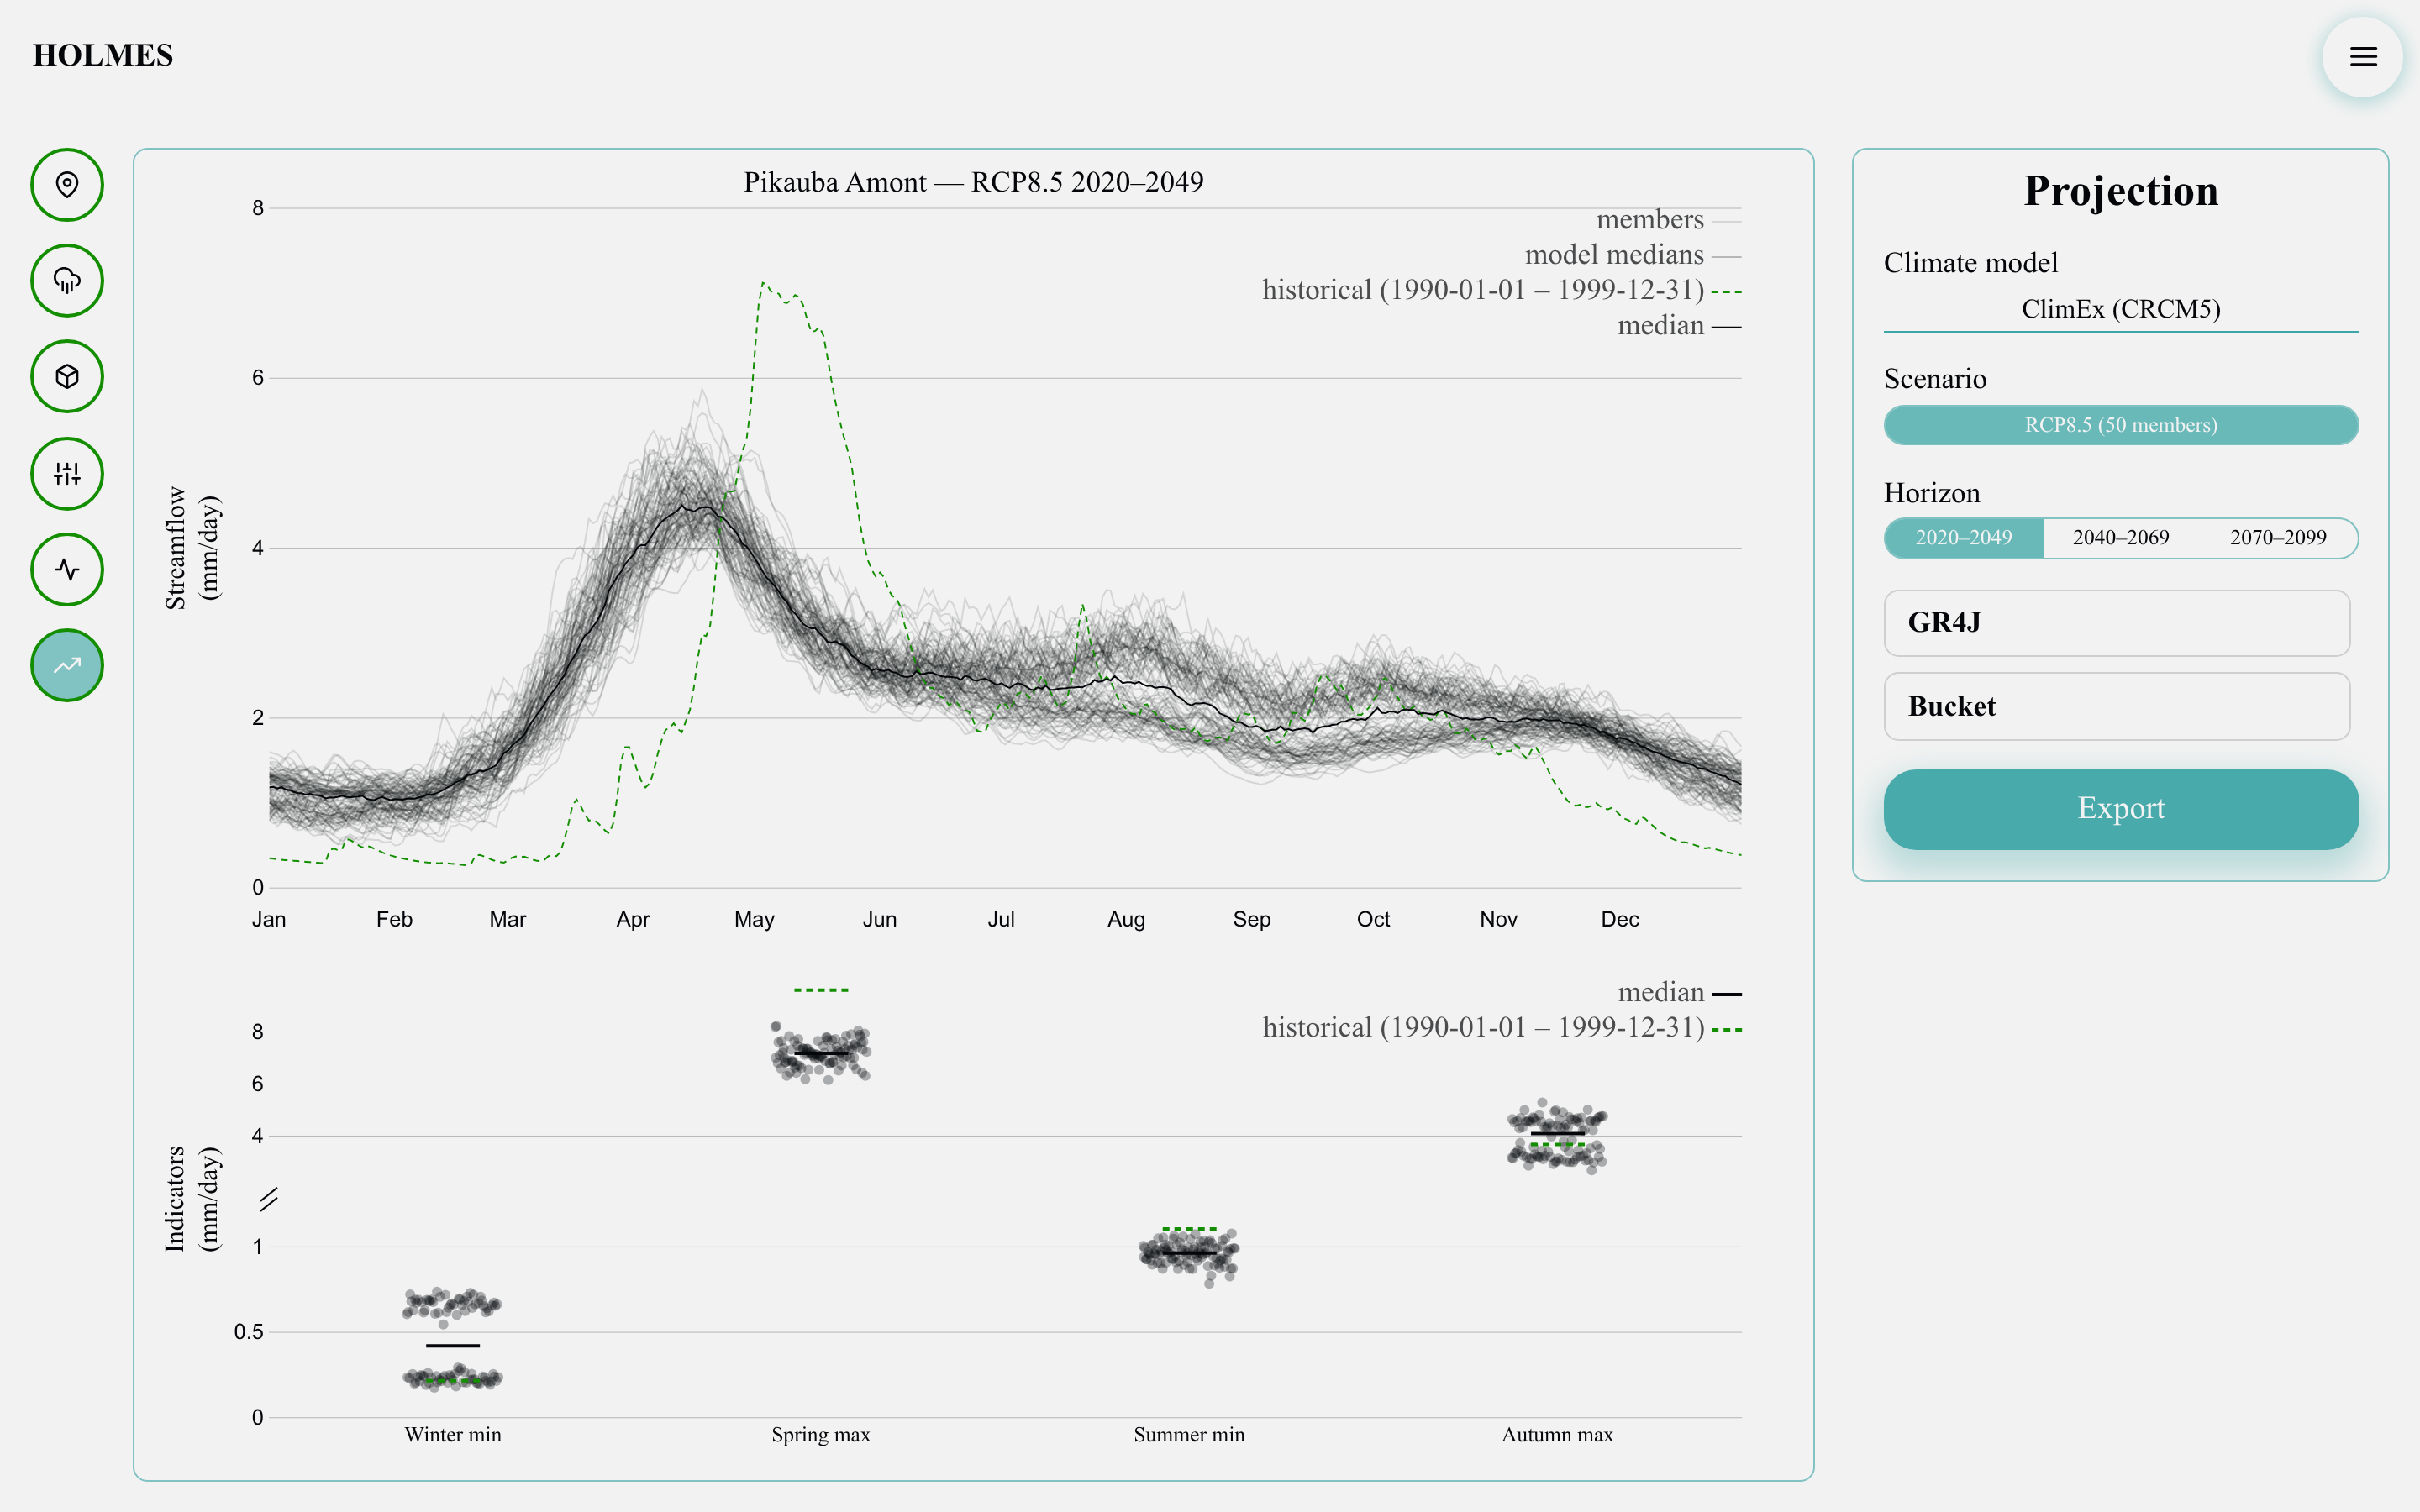
The regime chart
The top chart is the annual flow regime: mean streamflow (mm/day) per day of year over the horizon.
- one hairline per climate member — the ensemble spread;
- a median per hydrological model (shown for ensembles of models);
- the overall median on top;
- a dashed green historical reference: the same models run on observed weather over the simulation period, so the change in regime — earlier snowmelt, different flood timing — reads directly against the past.
The indicators chart
The bottom chart condenses each member's regime into four indicators — "Winter min", "Spring max", "Summer min" and "Autumn max", all in mm/day — with one dot per model and member, a solid median tick, and a dashed historical tick per column (the axis breaks so small and large indicators stay readable). It answers the operational questions directly: how much the spring flood shifts, how low the winter and summer low flows get, and how the autumn peak moves.