Stations
The Stations step picks the hydrometric stations — and therefore the watersheds — the whole pipeline works on, together with their time periods.
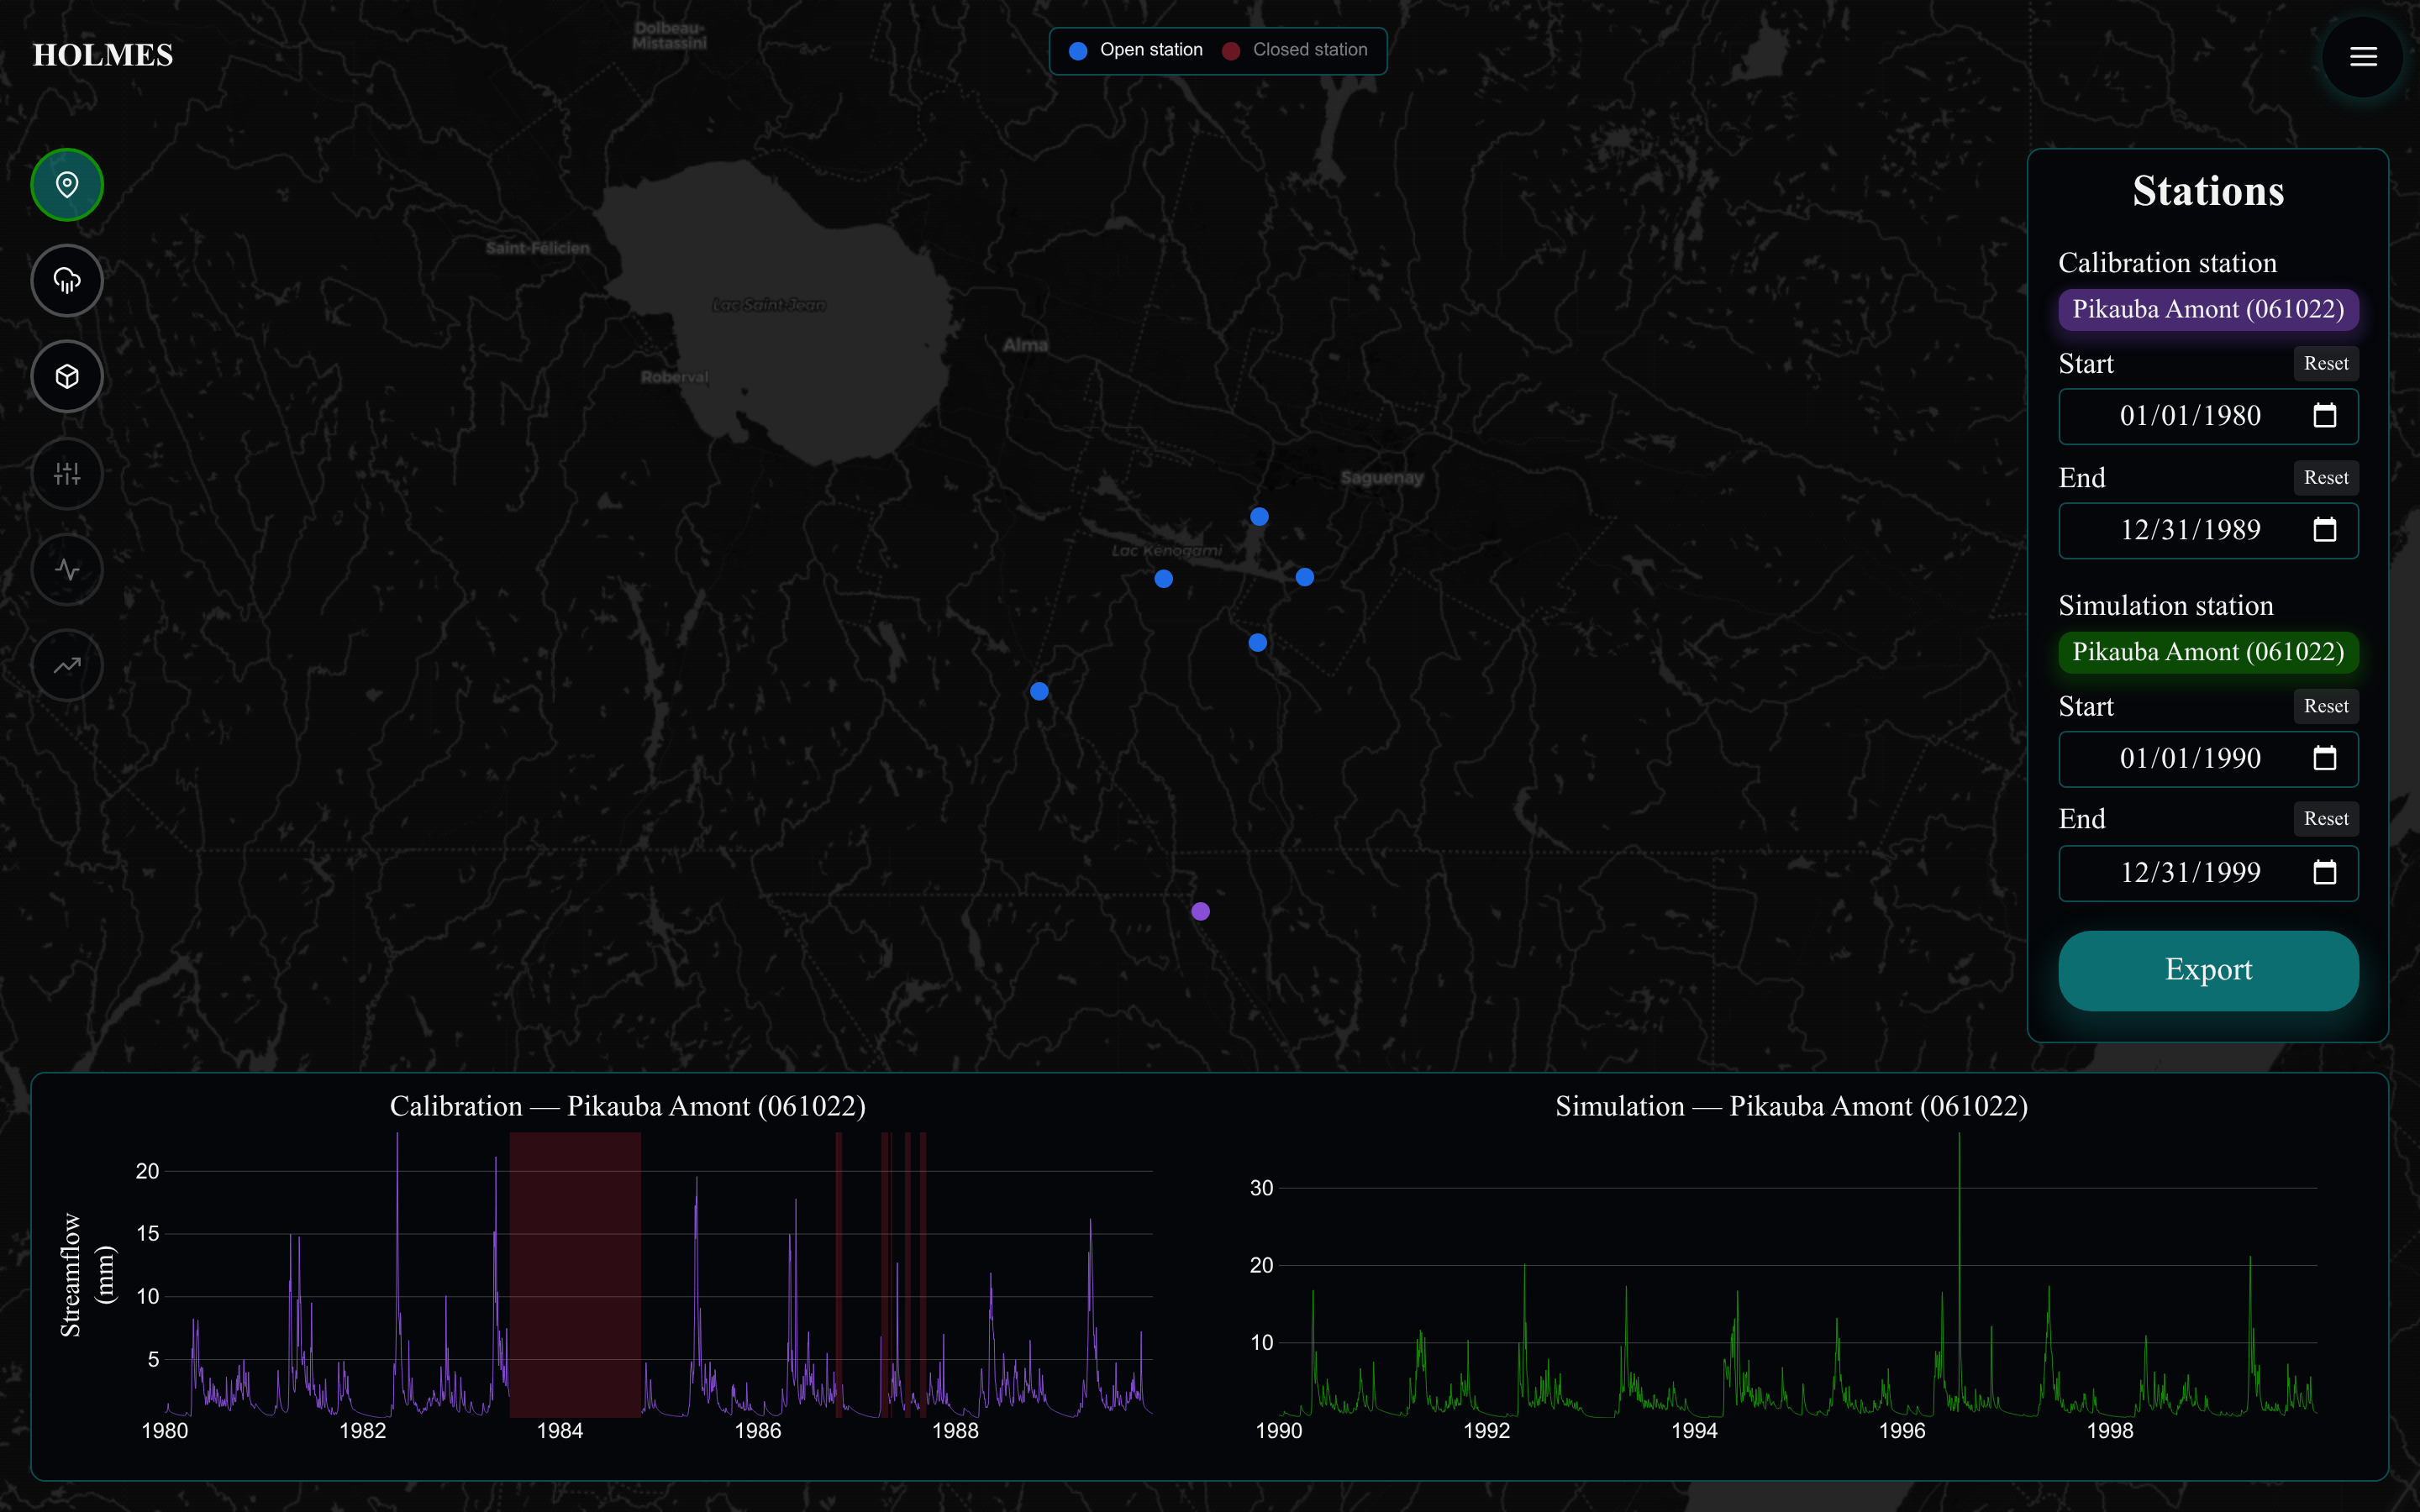
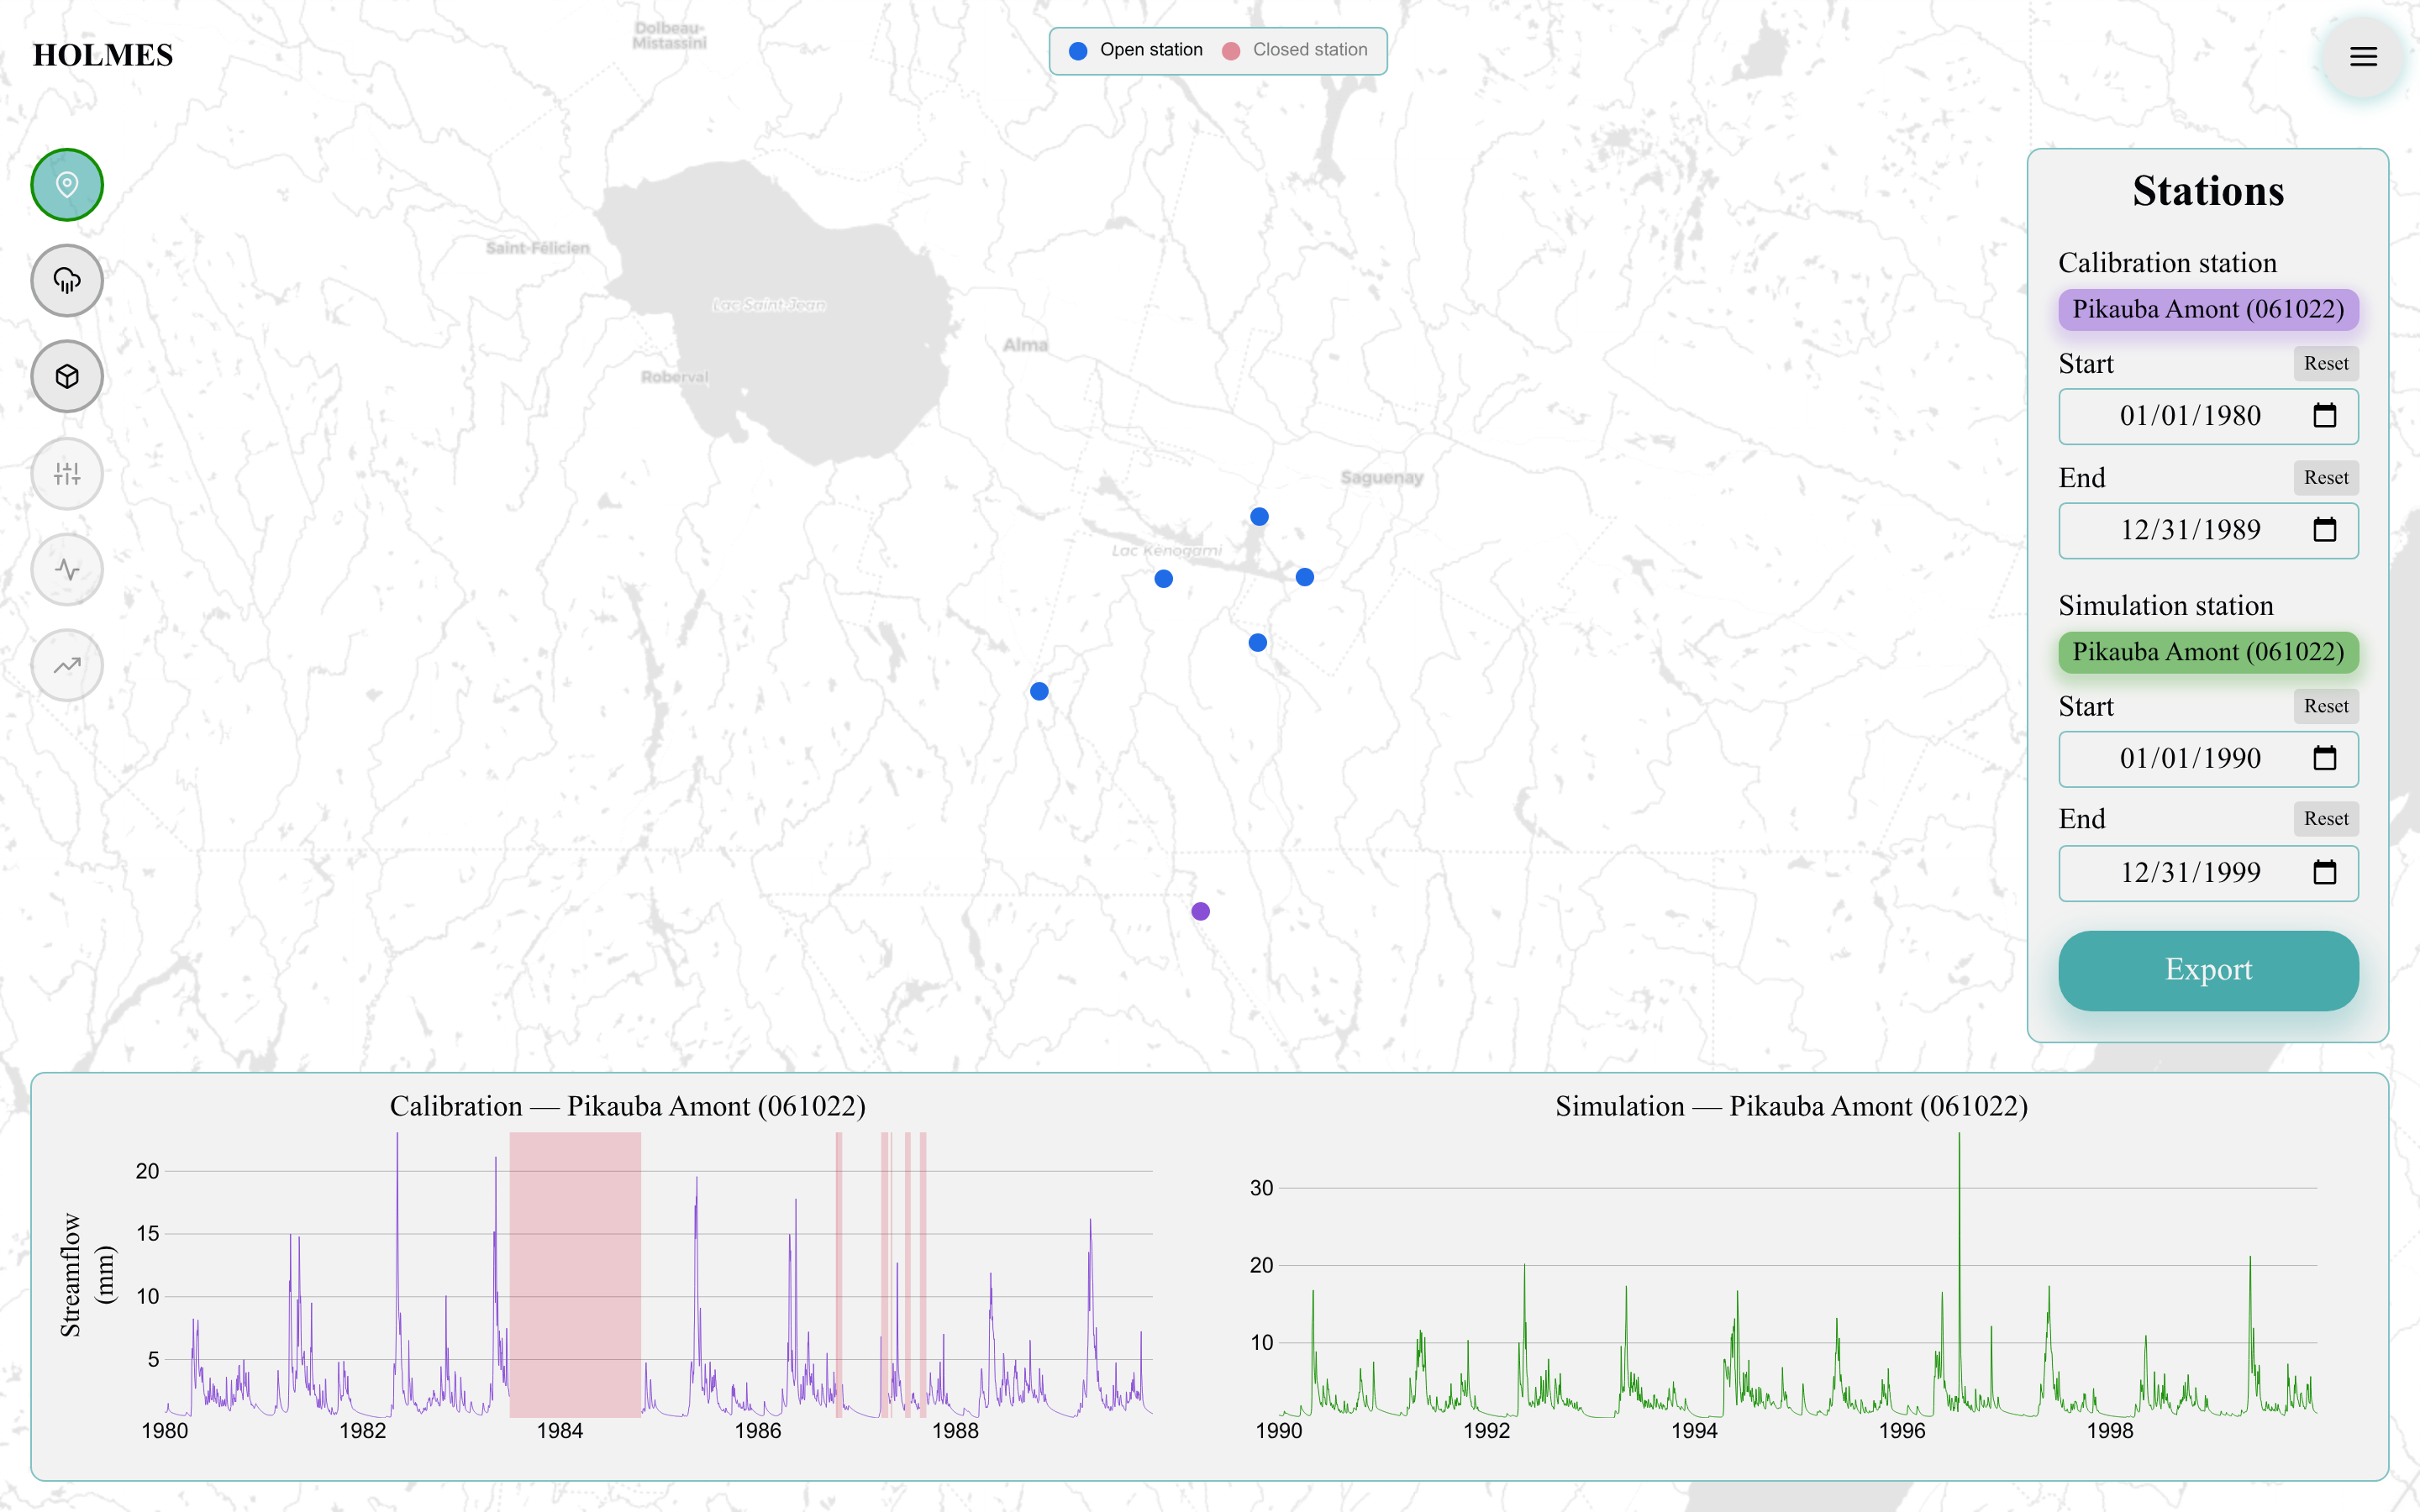
Roles: calibration and simulation
HOLMES always tracks two stations, one per role:
- The calibration station (purple) provides the observed streamflow the models are fitted against.
- The simulation station (green) is where the calibrated parameters are evaluated.
Using the same station with different periods gives a split-sample test; using a different station gives a proxy-basin test. Both stations and both periods must be set before the Weather step unlocks.
Controls
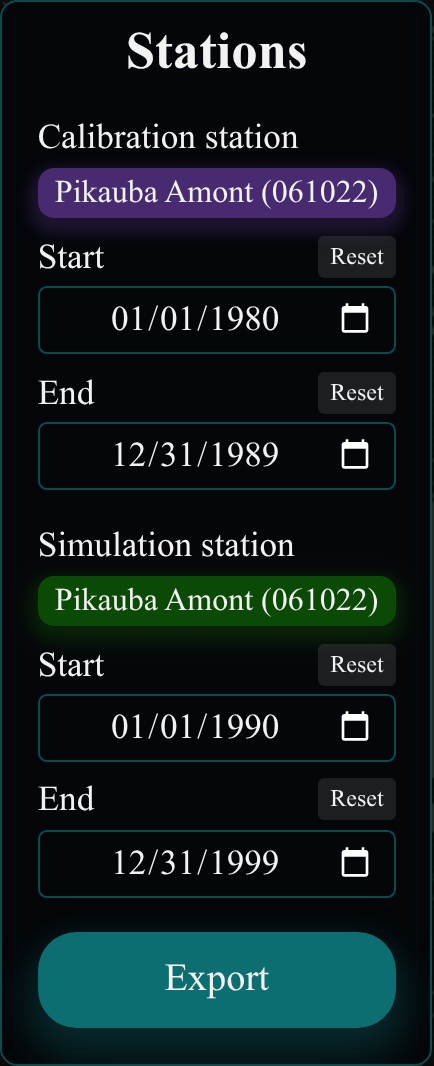
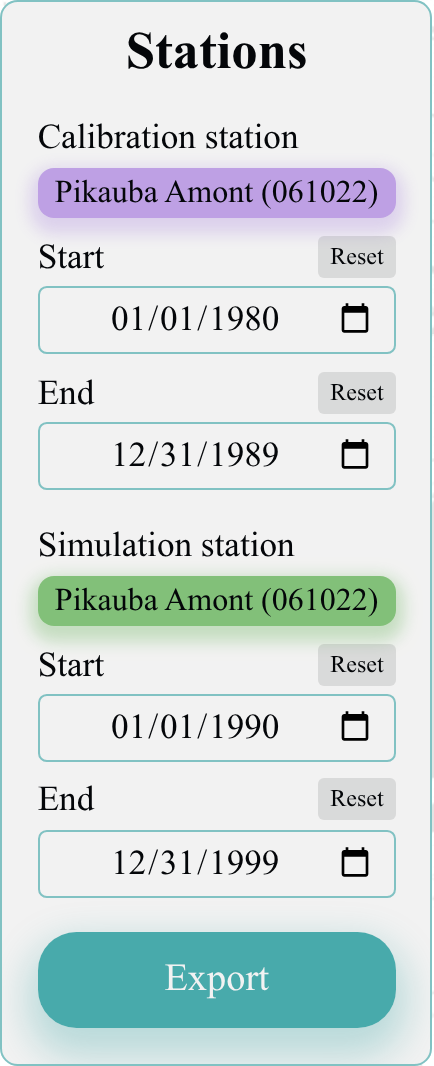
For each role:
- Station select — every available station as "Name (ID)". Picking one automatically fills the period with the station's full observed record.
- "Start" / "End" date fields — the analysis window. Each has a small reset button snapping back to the bound of the record. The calibration period is clamped to the station's observed record (there must be observations to fit against). The simulation period may extend beyond the record — back to 1940 or up to today — because streamflow can be reconstructed from weather alone (see Simulation). An inverted range (start after end) clears the period.
"Export" downloads the loaded observed streamflow as one CSV per selected role (streamflow_<role>_<id>.csv, columns datetime,streamflow in mm/day, full record).
The map
- Each circle is a hydrometric station; hover it to see its name and its watershed outline.
- Click a station to open its card: identifier, watershed area, record start (and end for closed stations), plus "Use as calibration" and "Use as simulation" buttons — an alternative to the dropdowns. Click anywhere else on the map to close it.
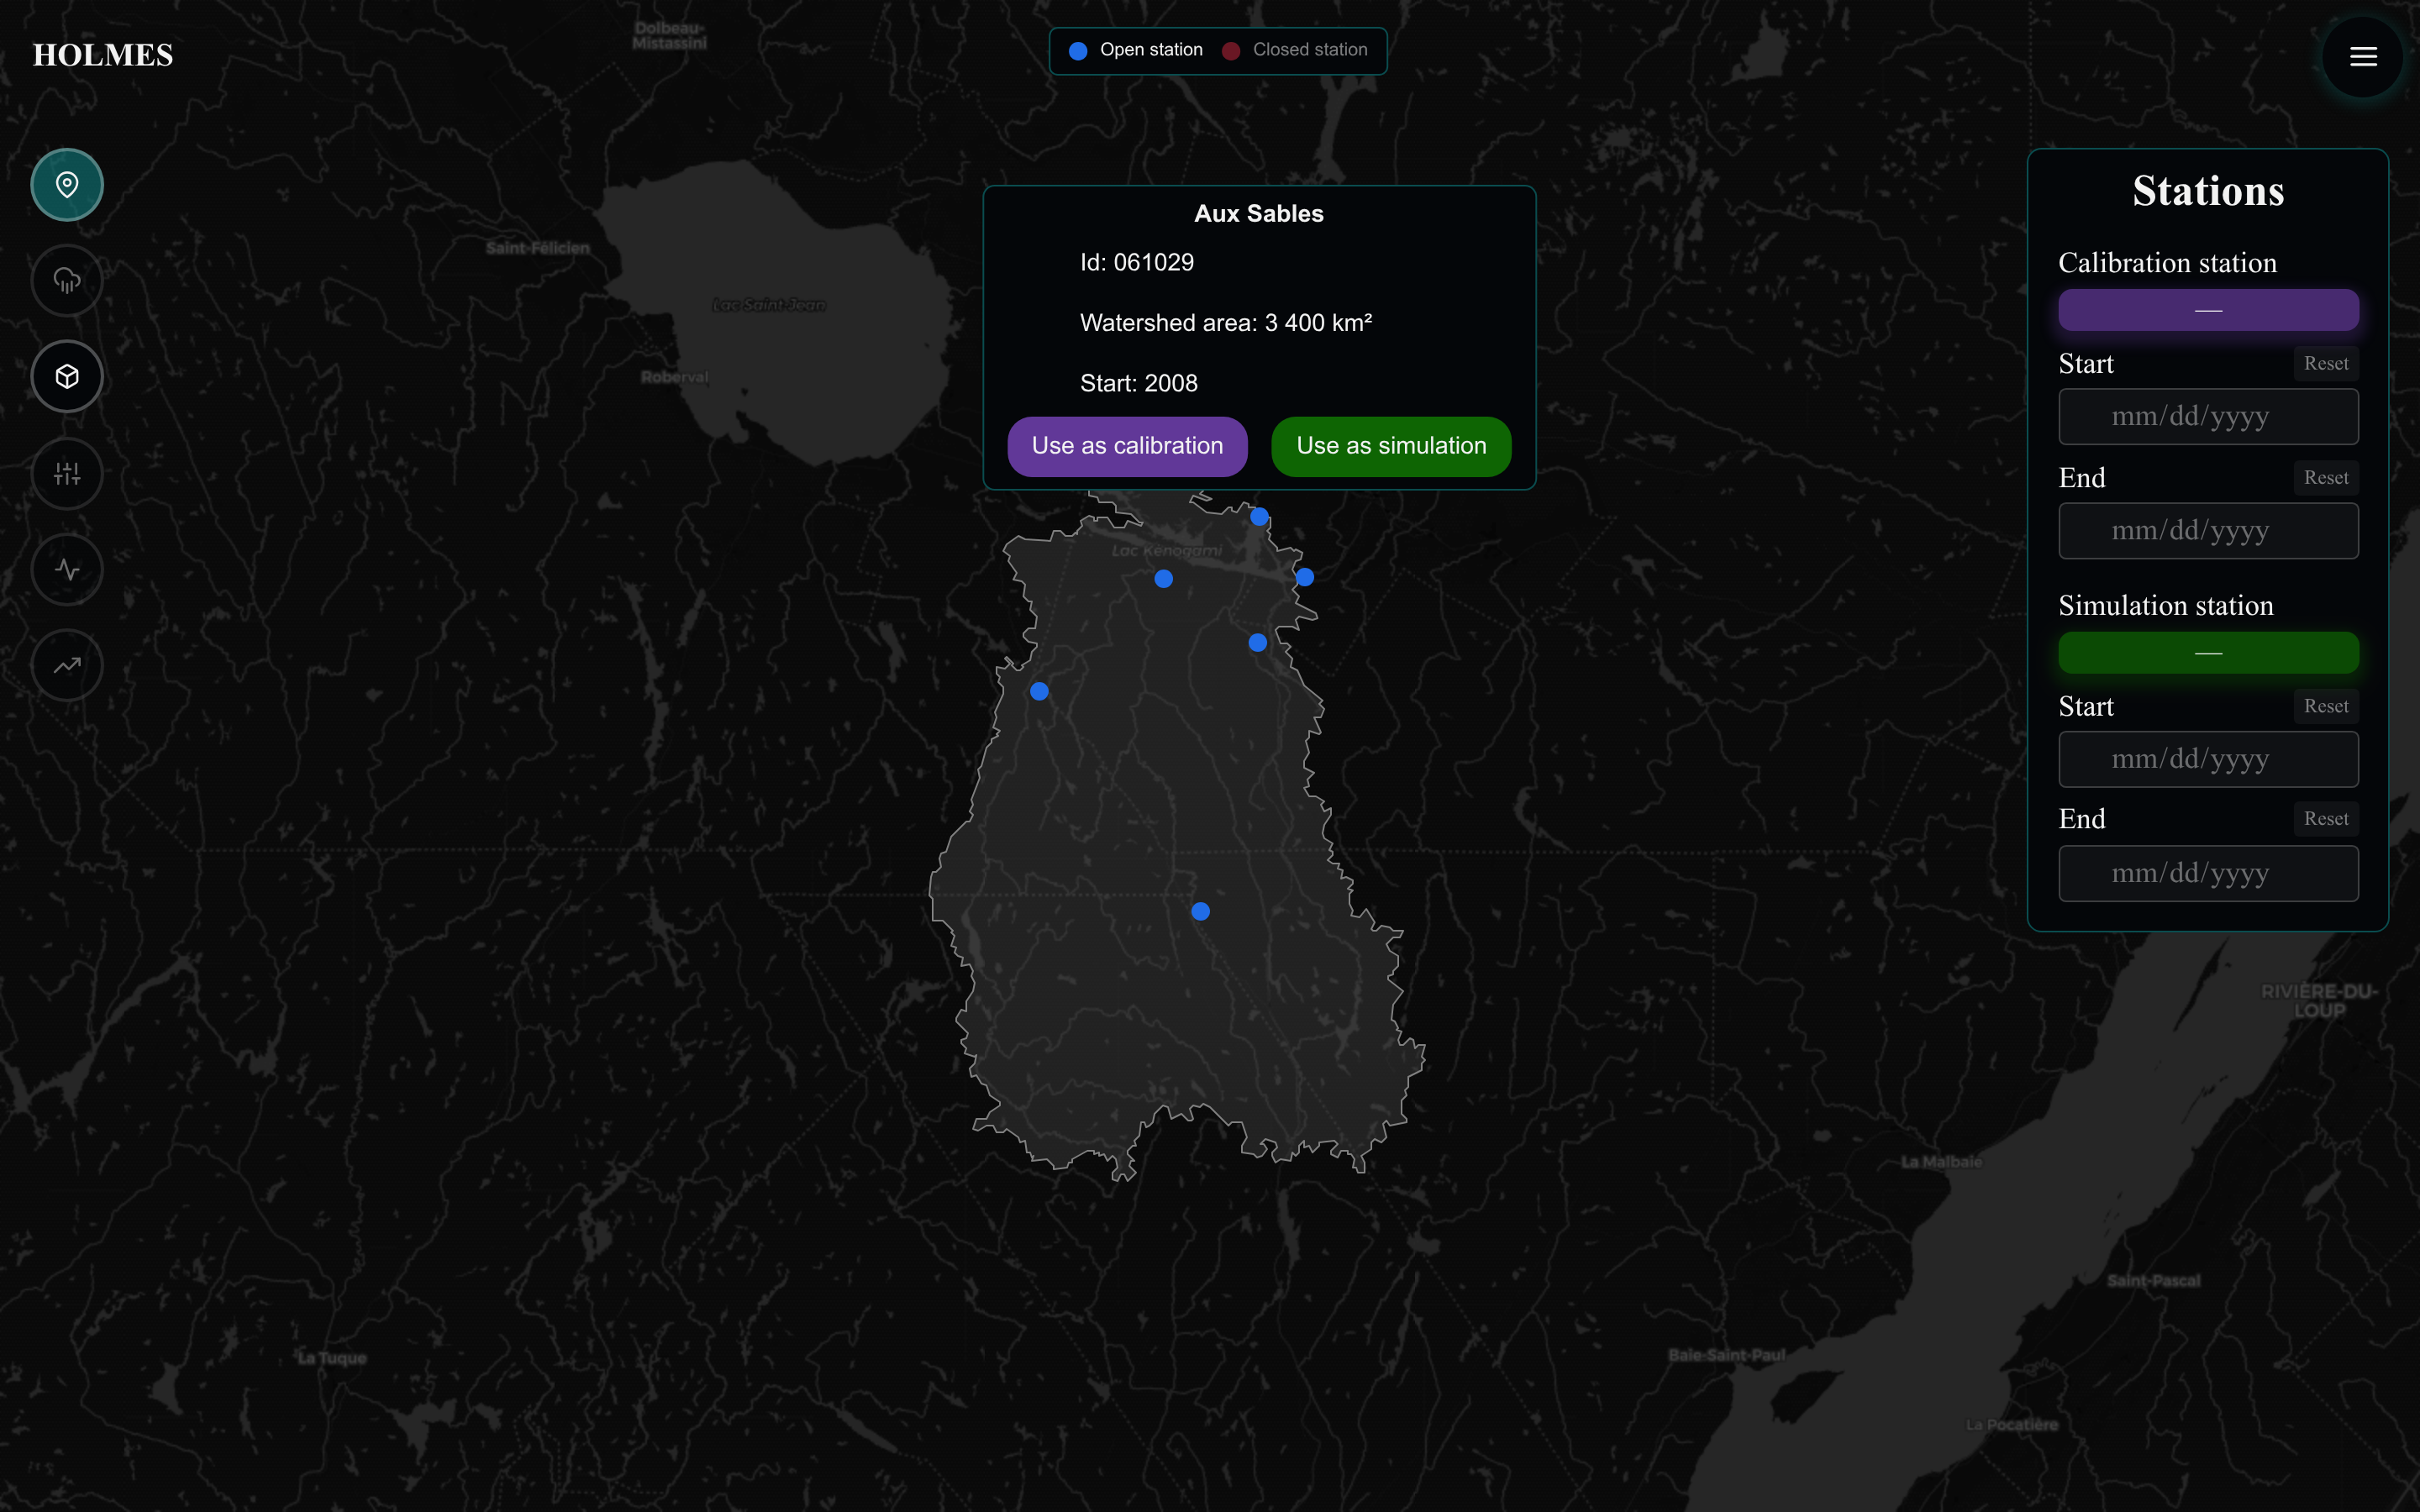
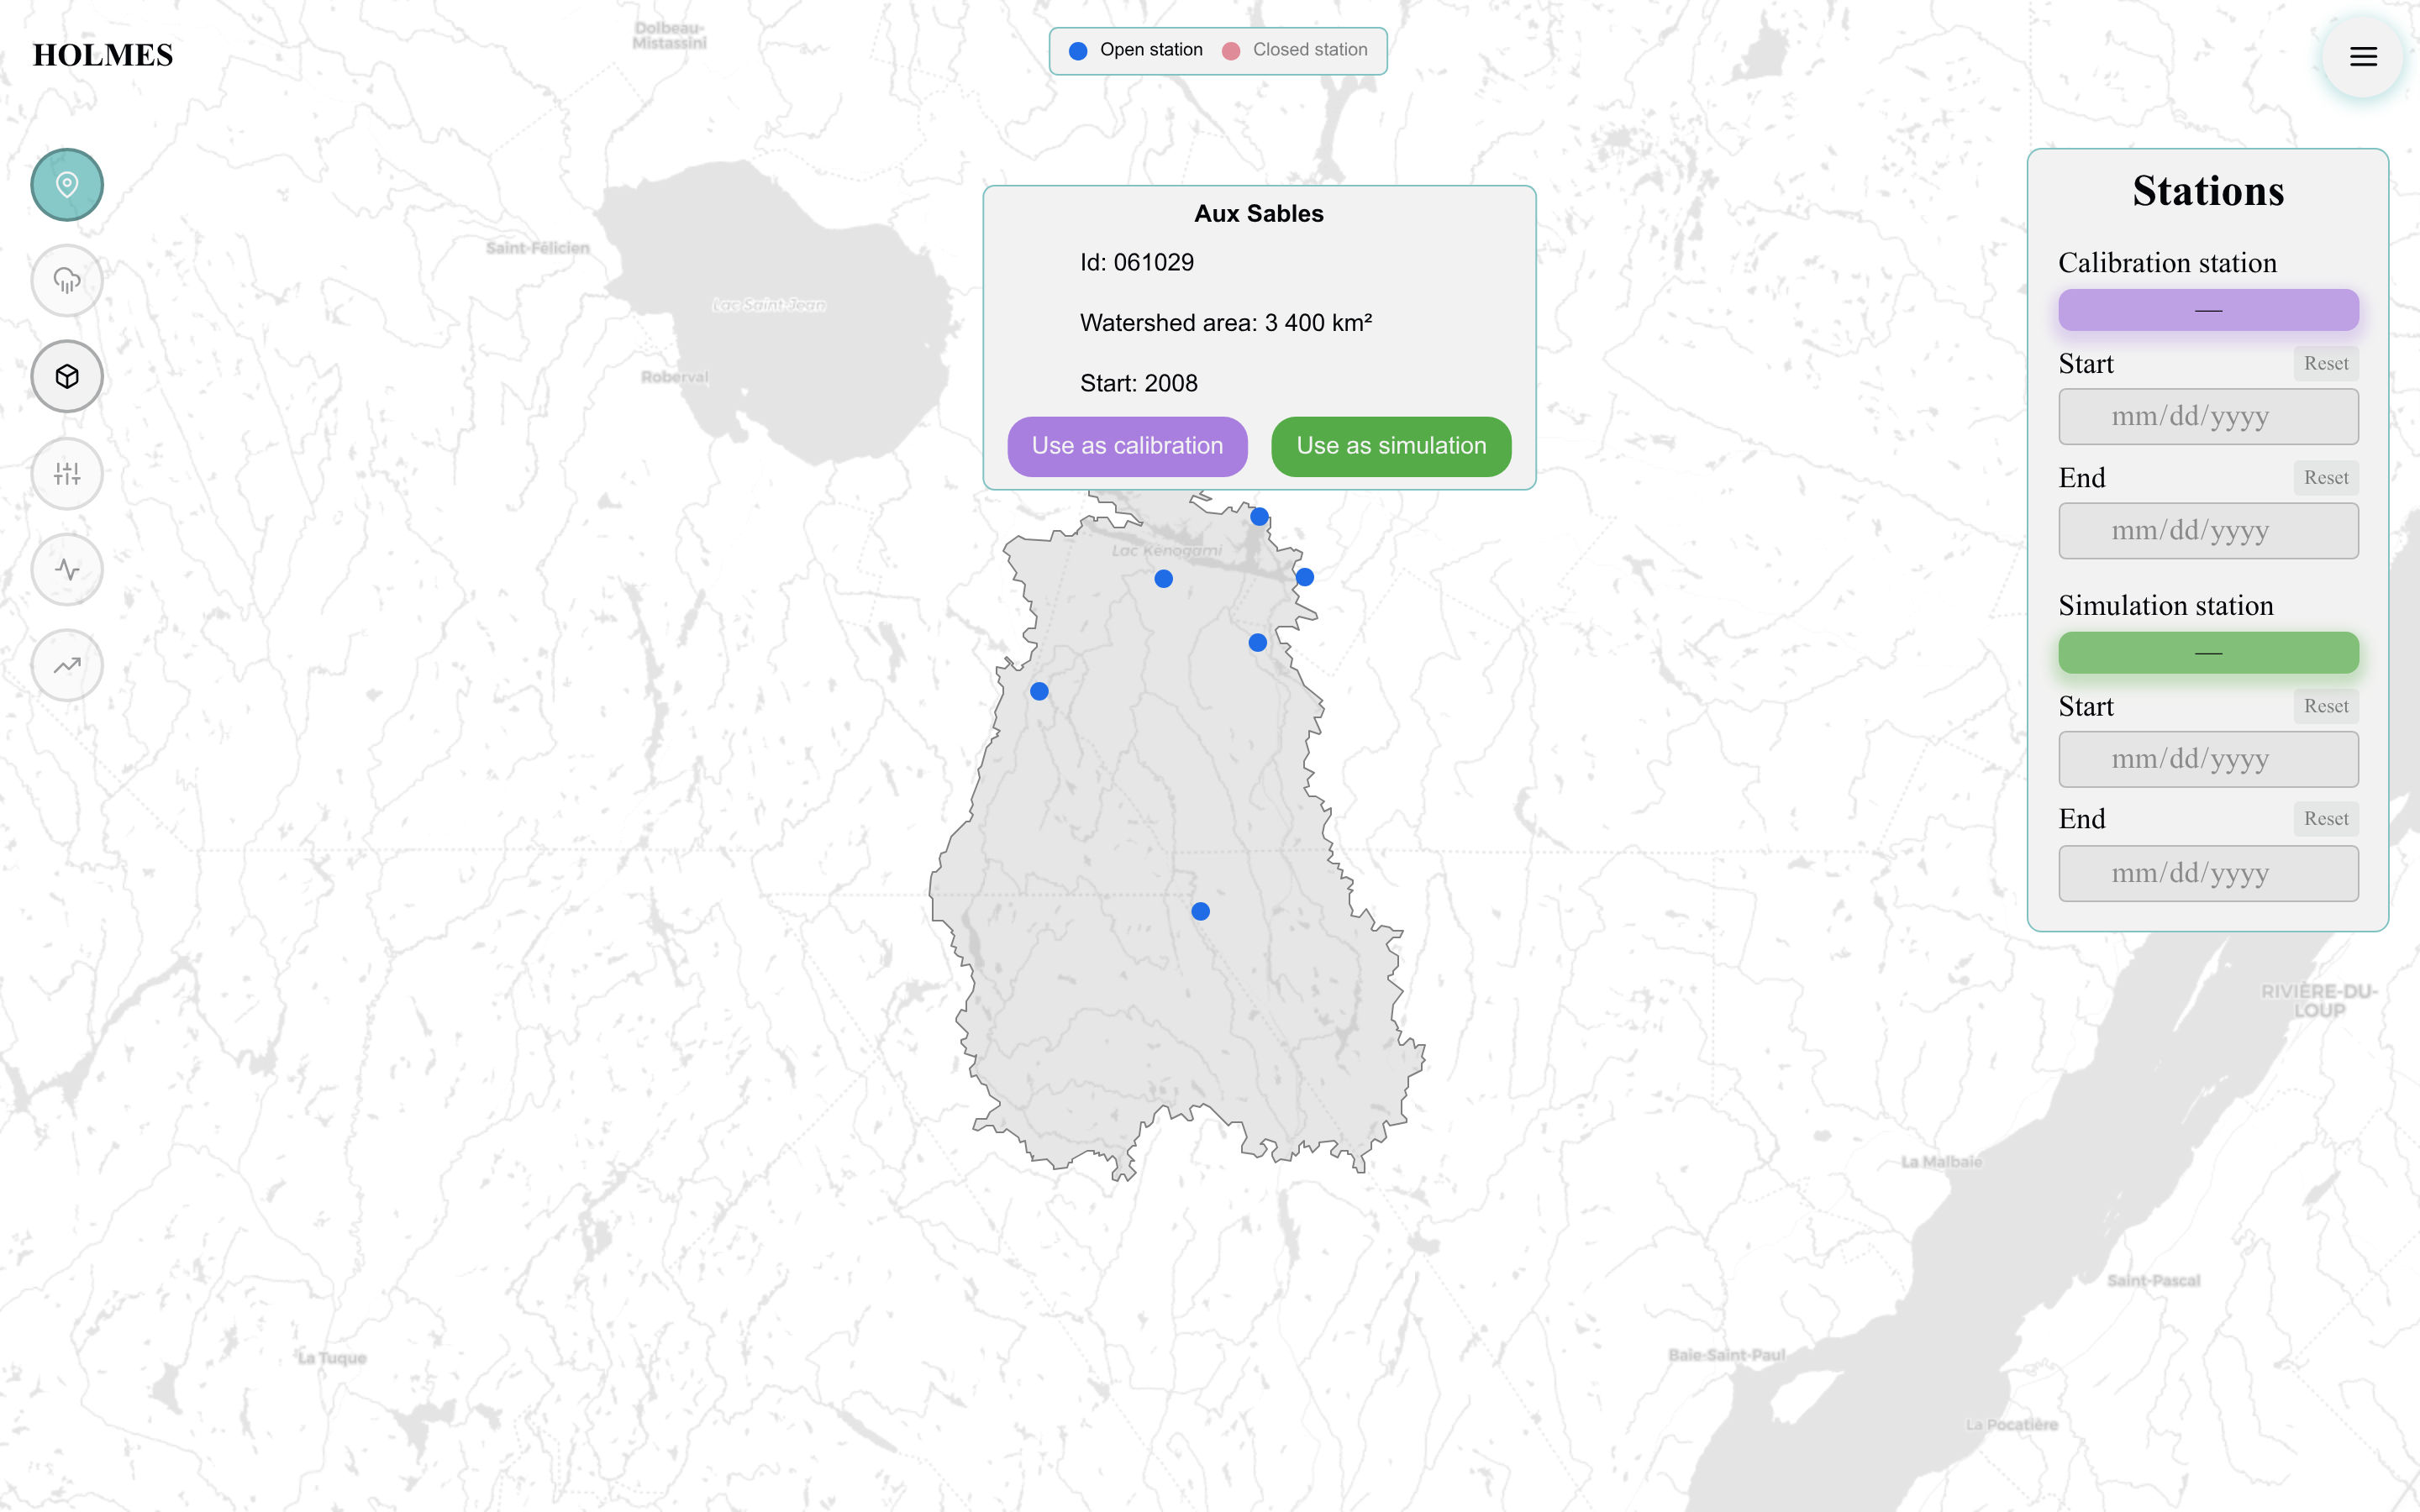
- The legend items "Open station" and "Closed station" toggle each group's visibility. Closed stations (no longer measuring) are hidden by default; selected stations always stay visible.
Hydrographs
The bottom panel draws the observed streamflow of each configured role over its selected period, in the role's color.


Streamflow is expressed in mm/day (volume normalized by watershed area), which is what makes values comparable across watersheds of different sizes.