Weather
The Weather step picks the meteorological forcing — daily precipitation and temperature averaged over each selected watershed — that drives the models. Comparing methods is itself a modeling exercise: observed stations and reanalyses disagree, and that disagreement propagates into the simulated streamflow.
The three methods
Selecting a method loads its data; picking another method while a load is running cancels the first one. As on the Stations map, hovering a station draws its watershed — the screenshots below show it under each method's sources.
"Nearest stations"
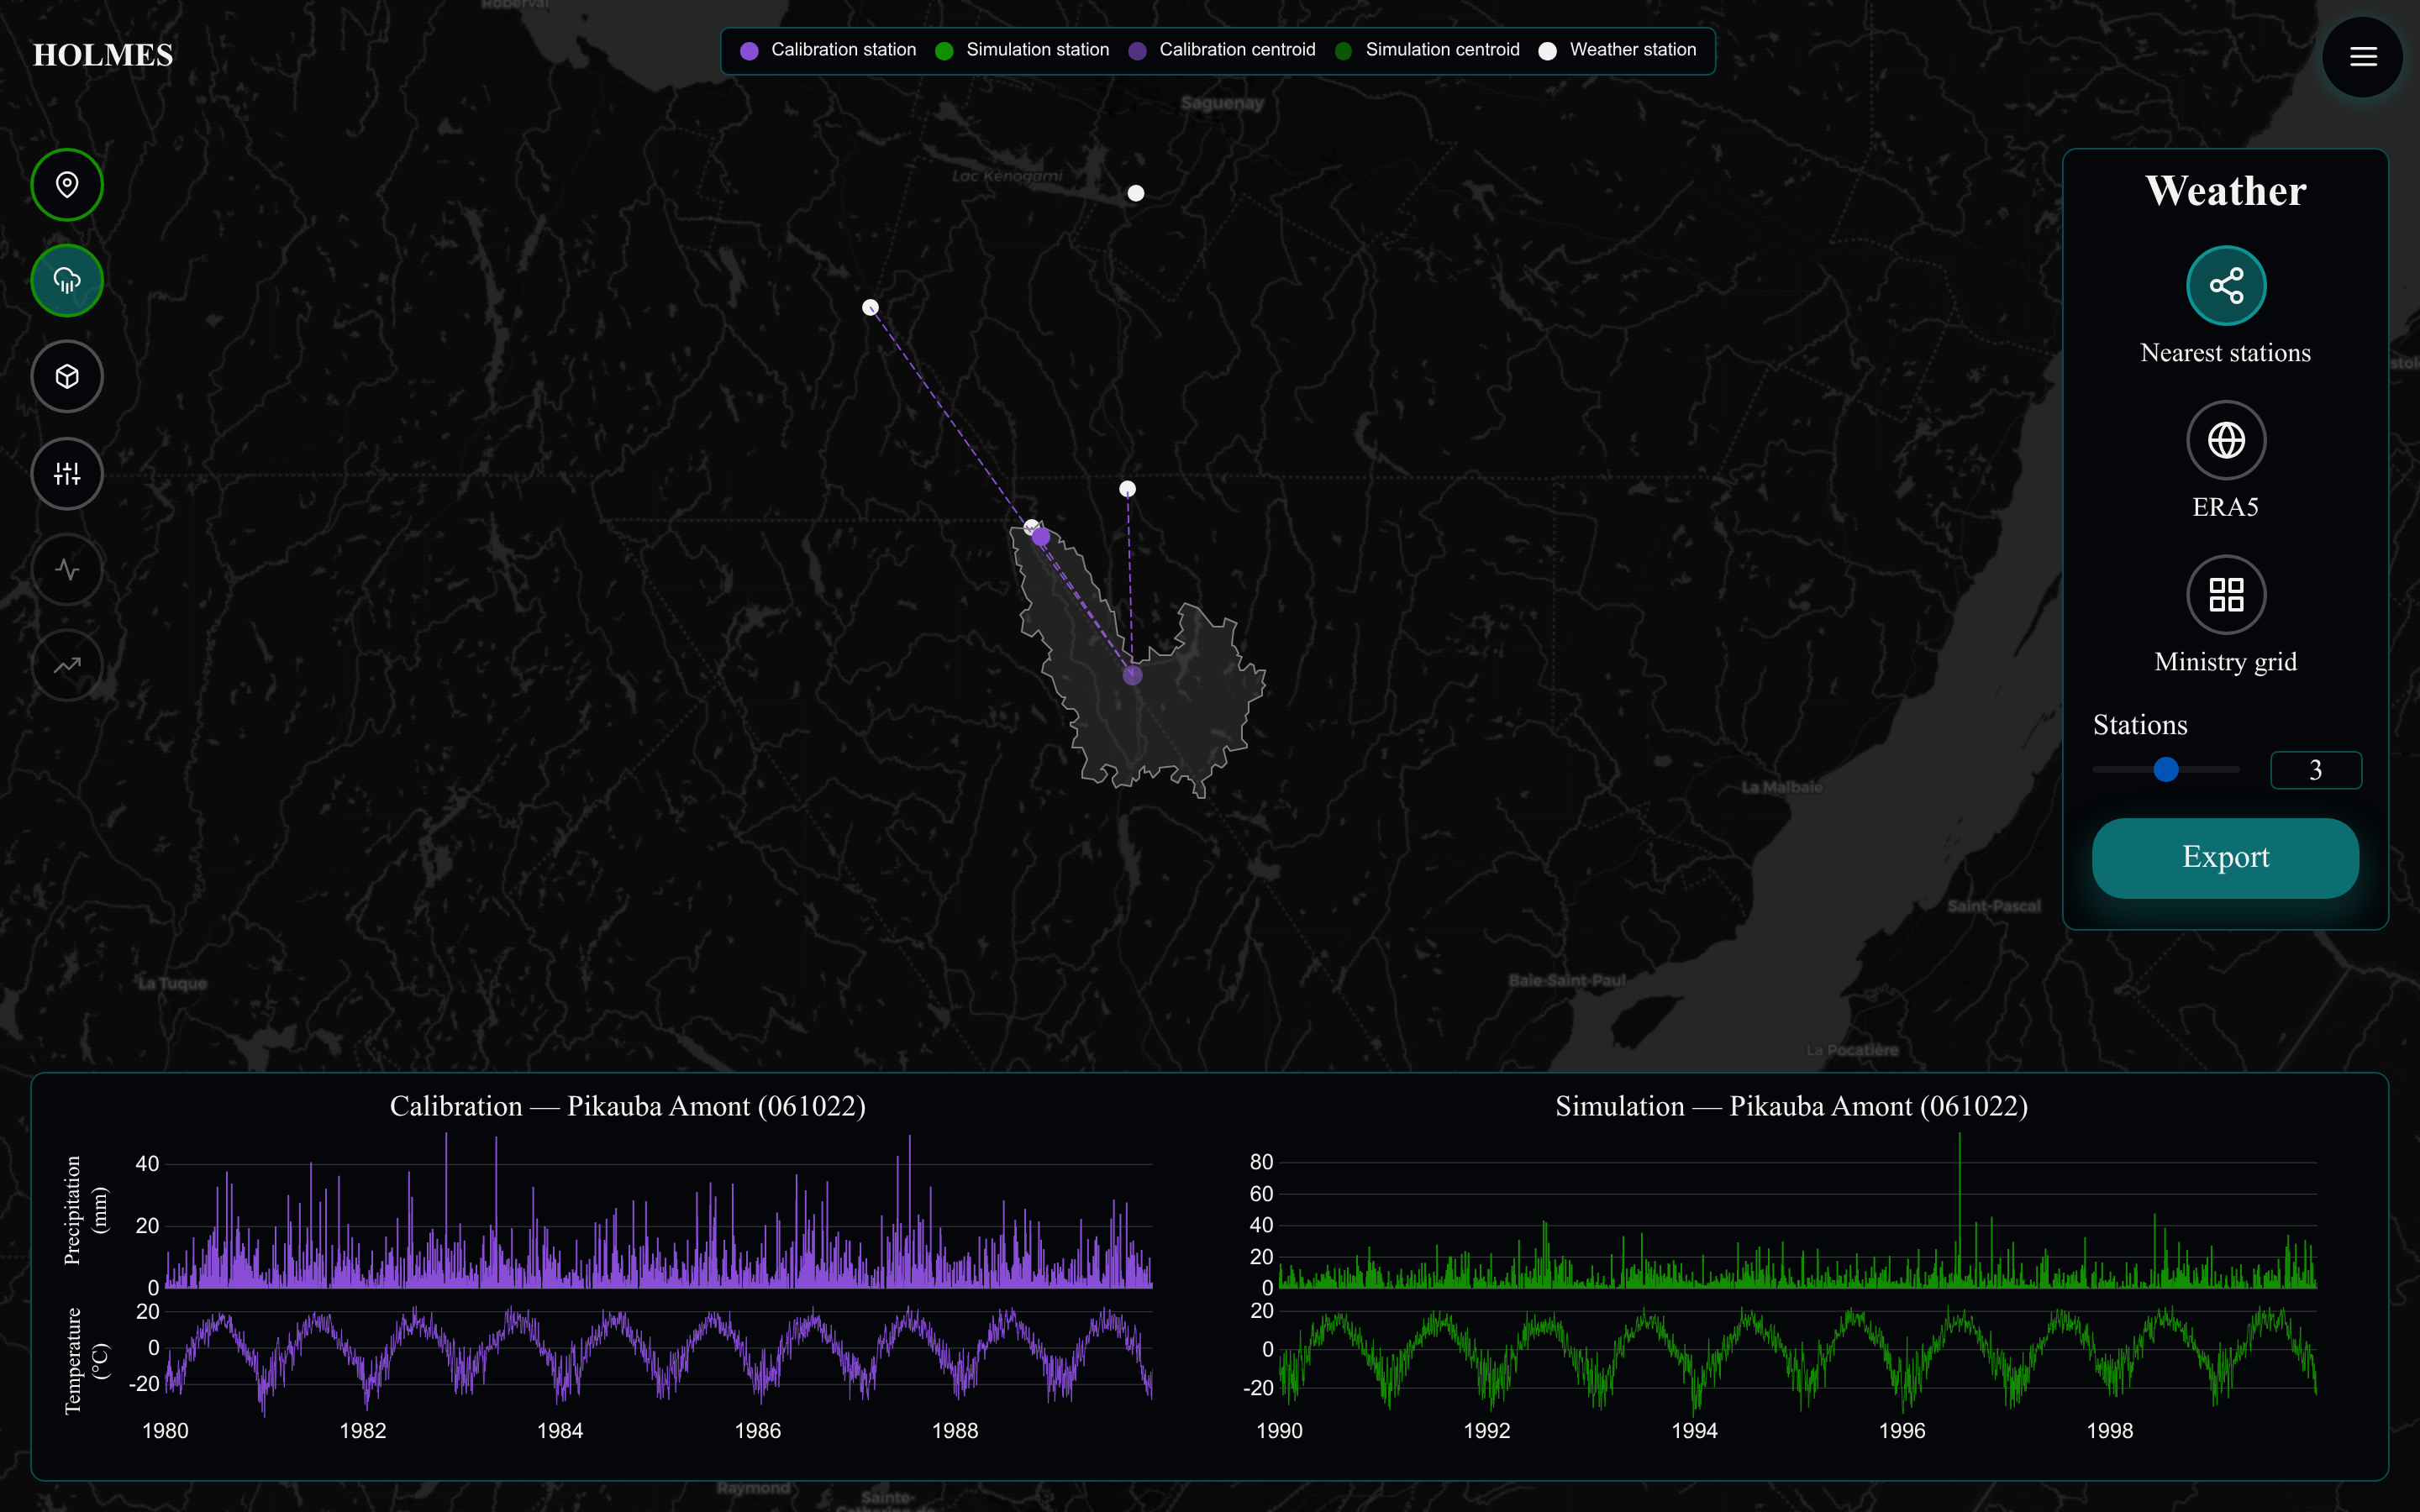
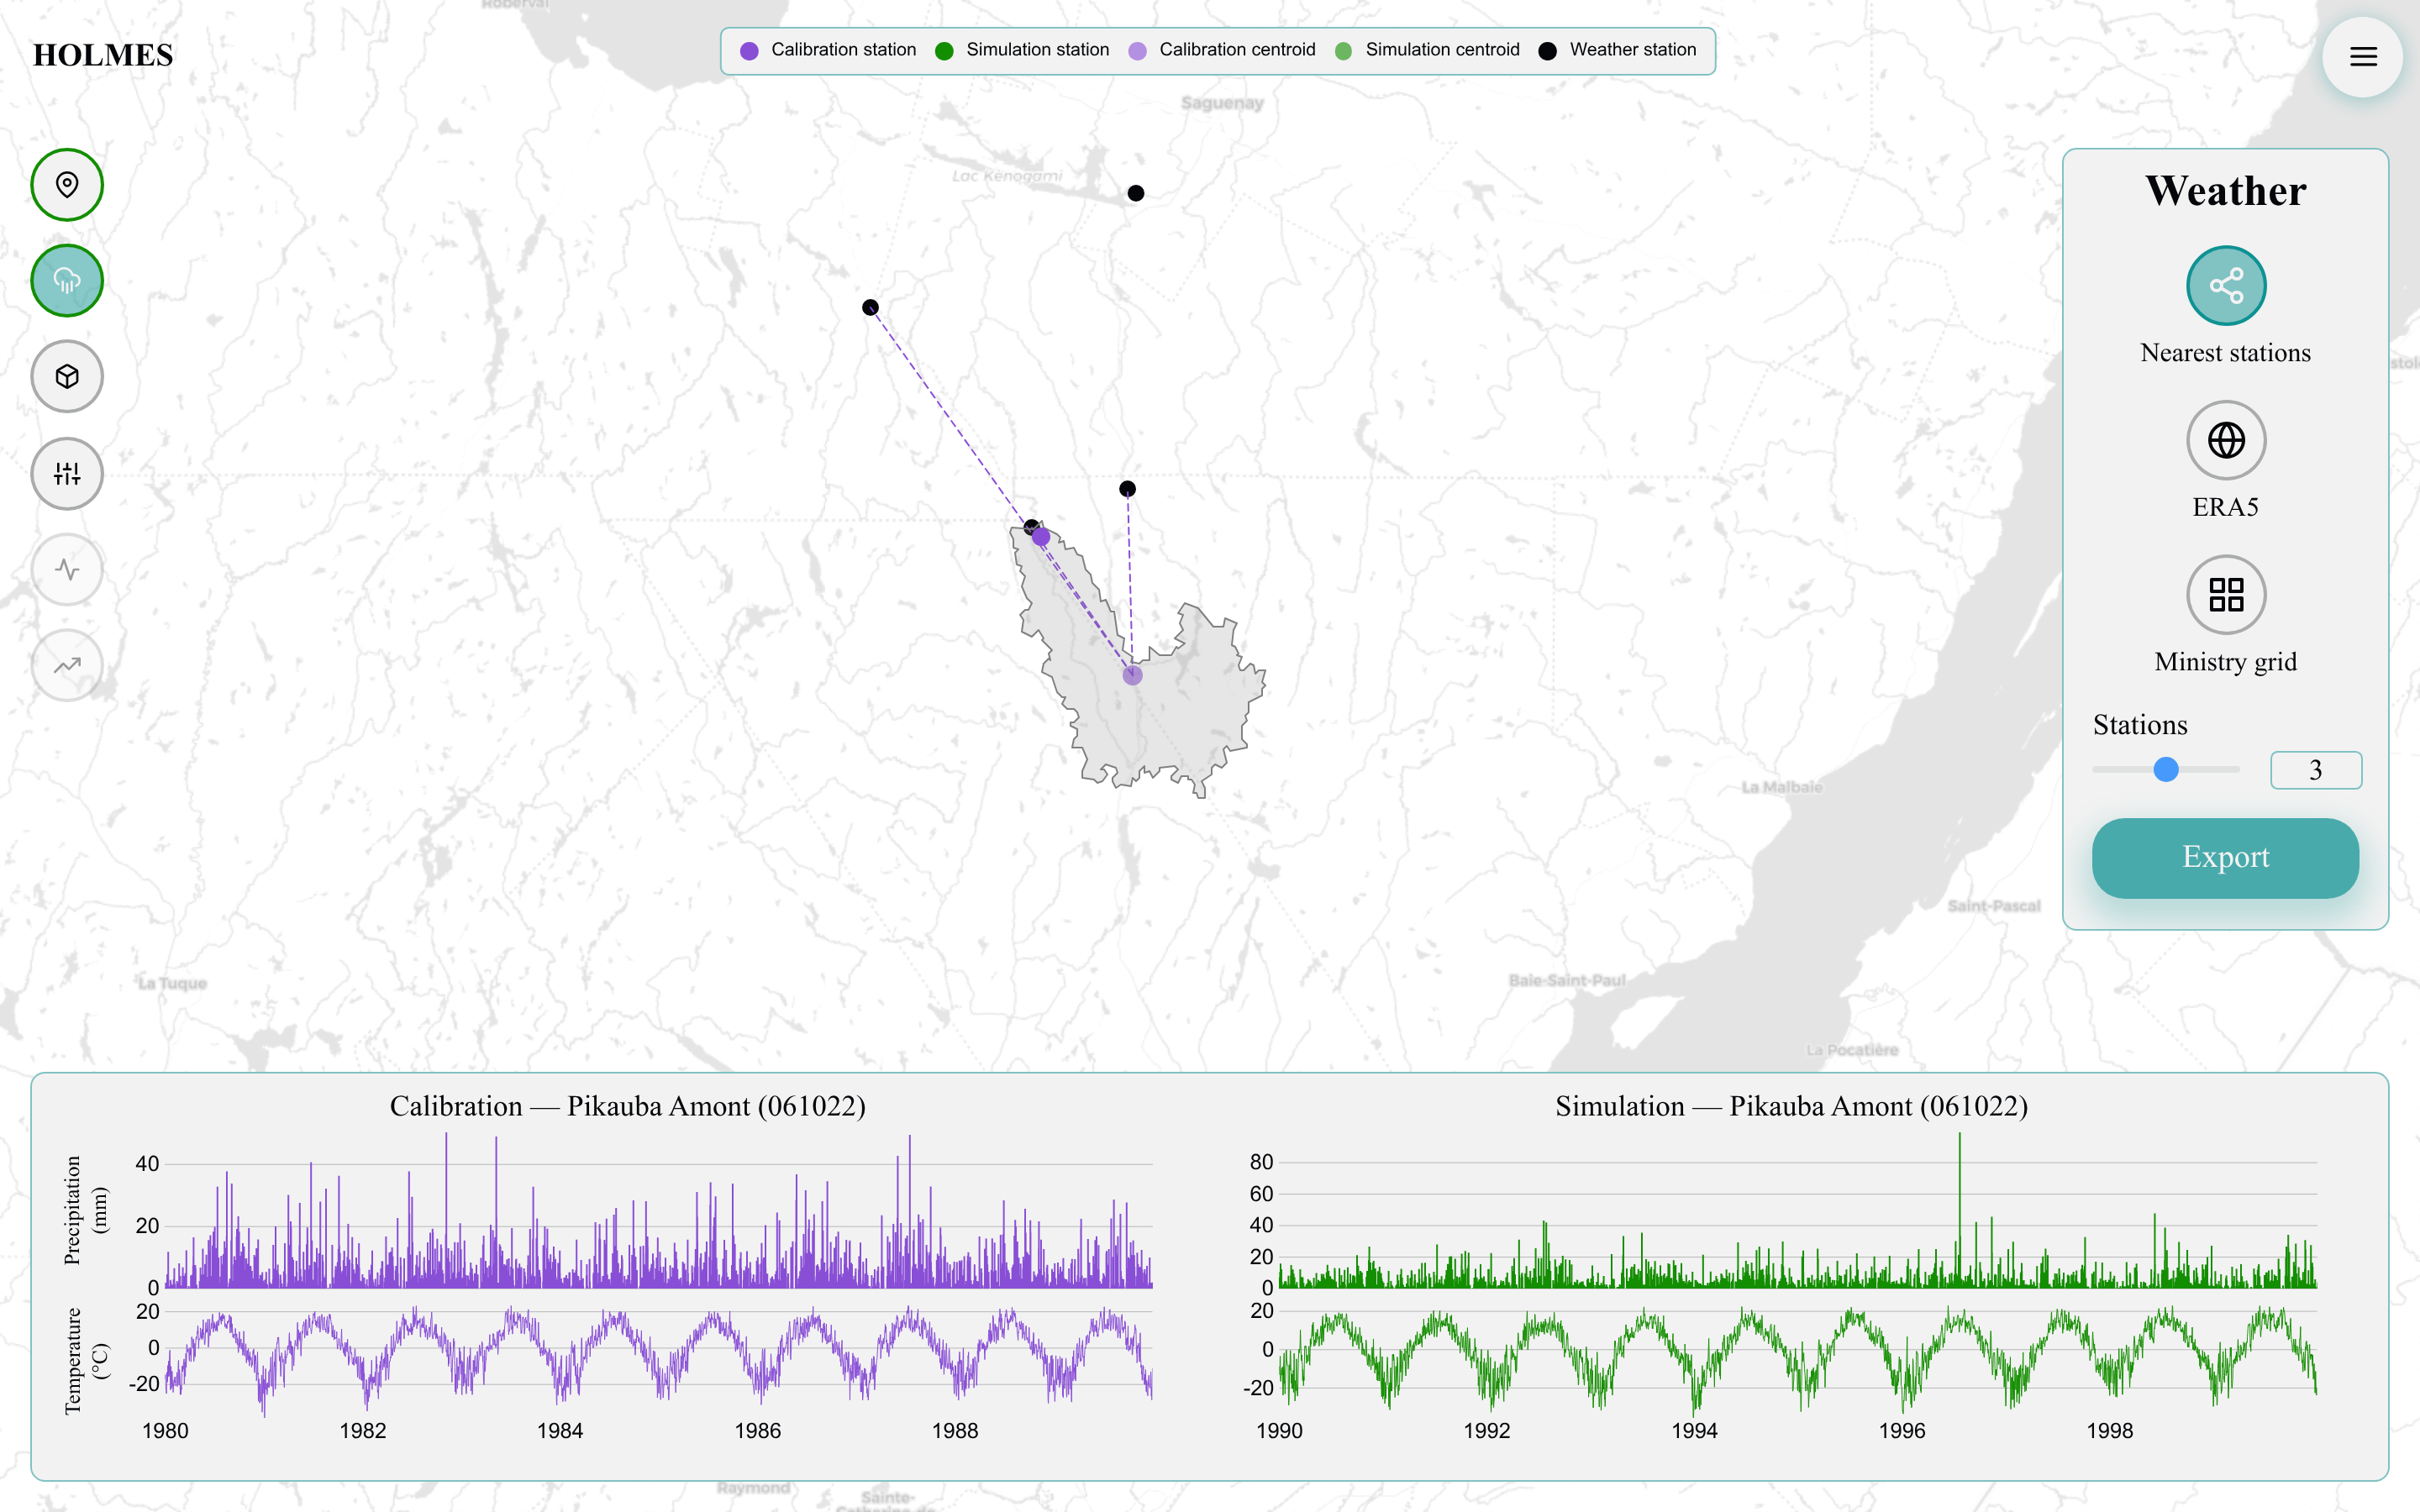
Observed daily records from Québec ministry (MELCC) weather stations. The closest stations to the watershed centroid are combined by inverse-distance weighting (closer stations weigh more, as 1/d²). The "Stations" slider (1–5, default 3) sets how many stations feed the mean. The map draws each weather station, the watershed centroids, and a line from each centroid to the stations it actually uses; hovering a centroid highlights its links.
"ERA5"
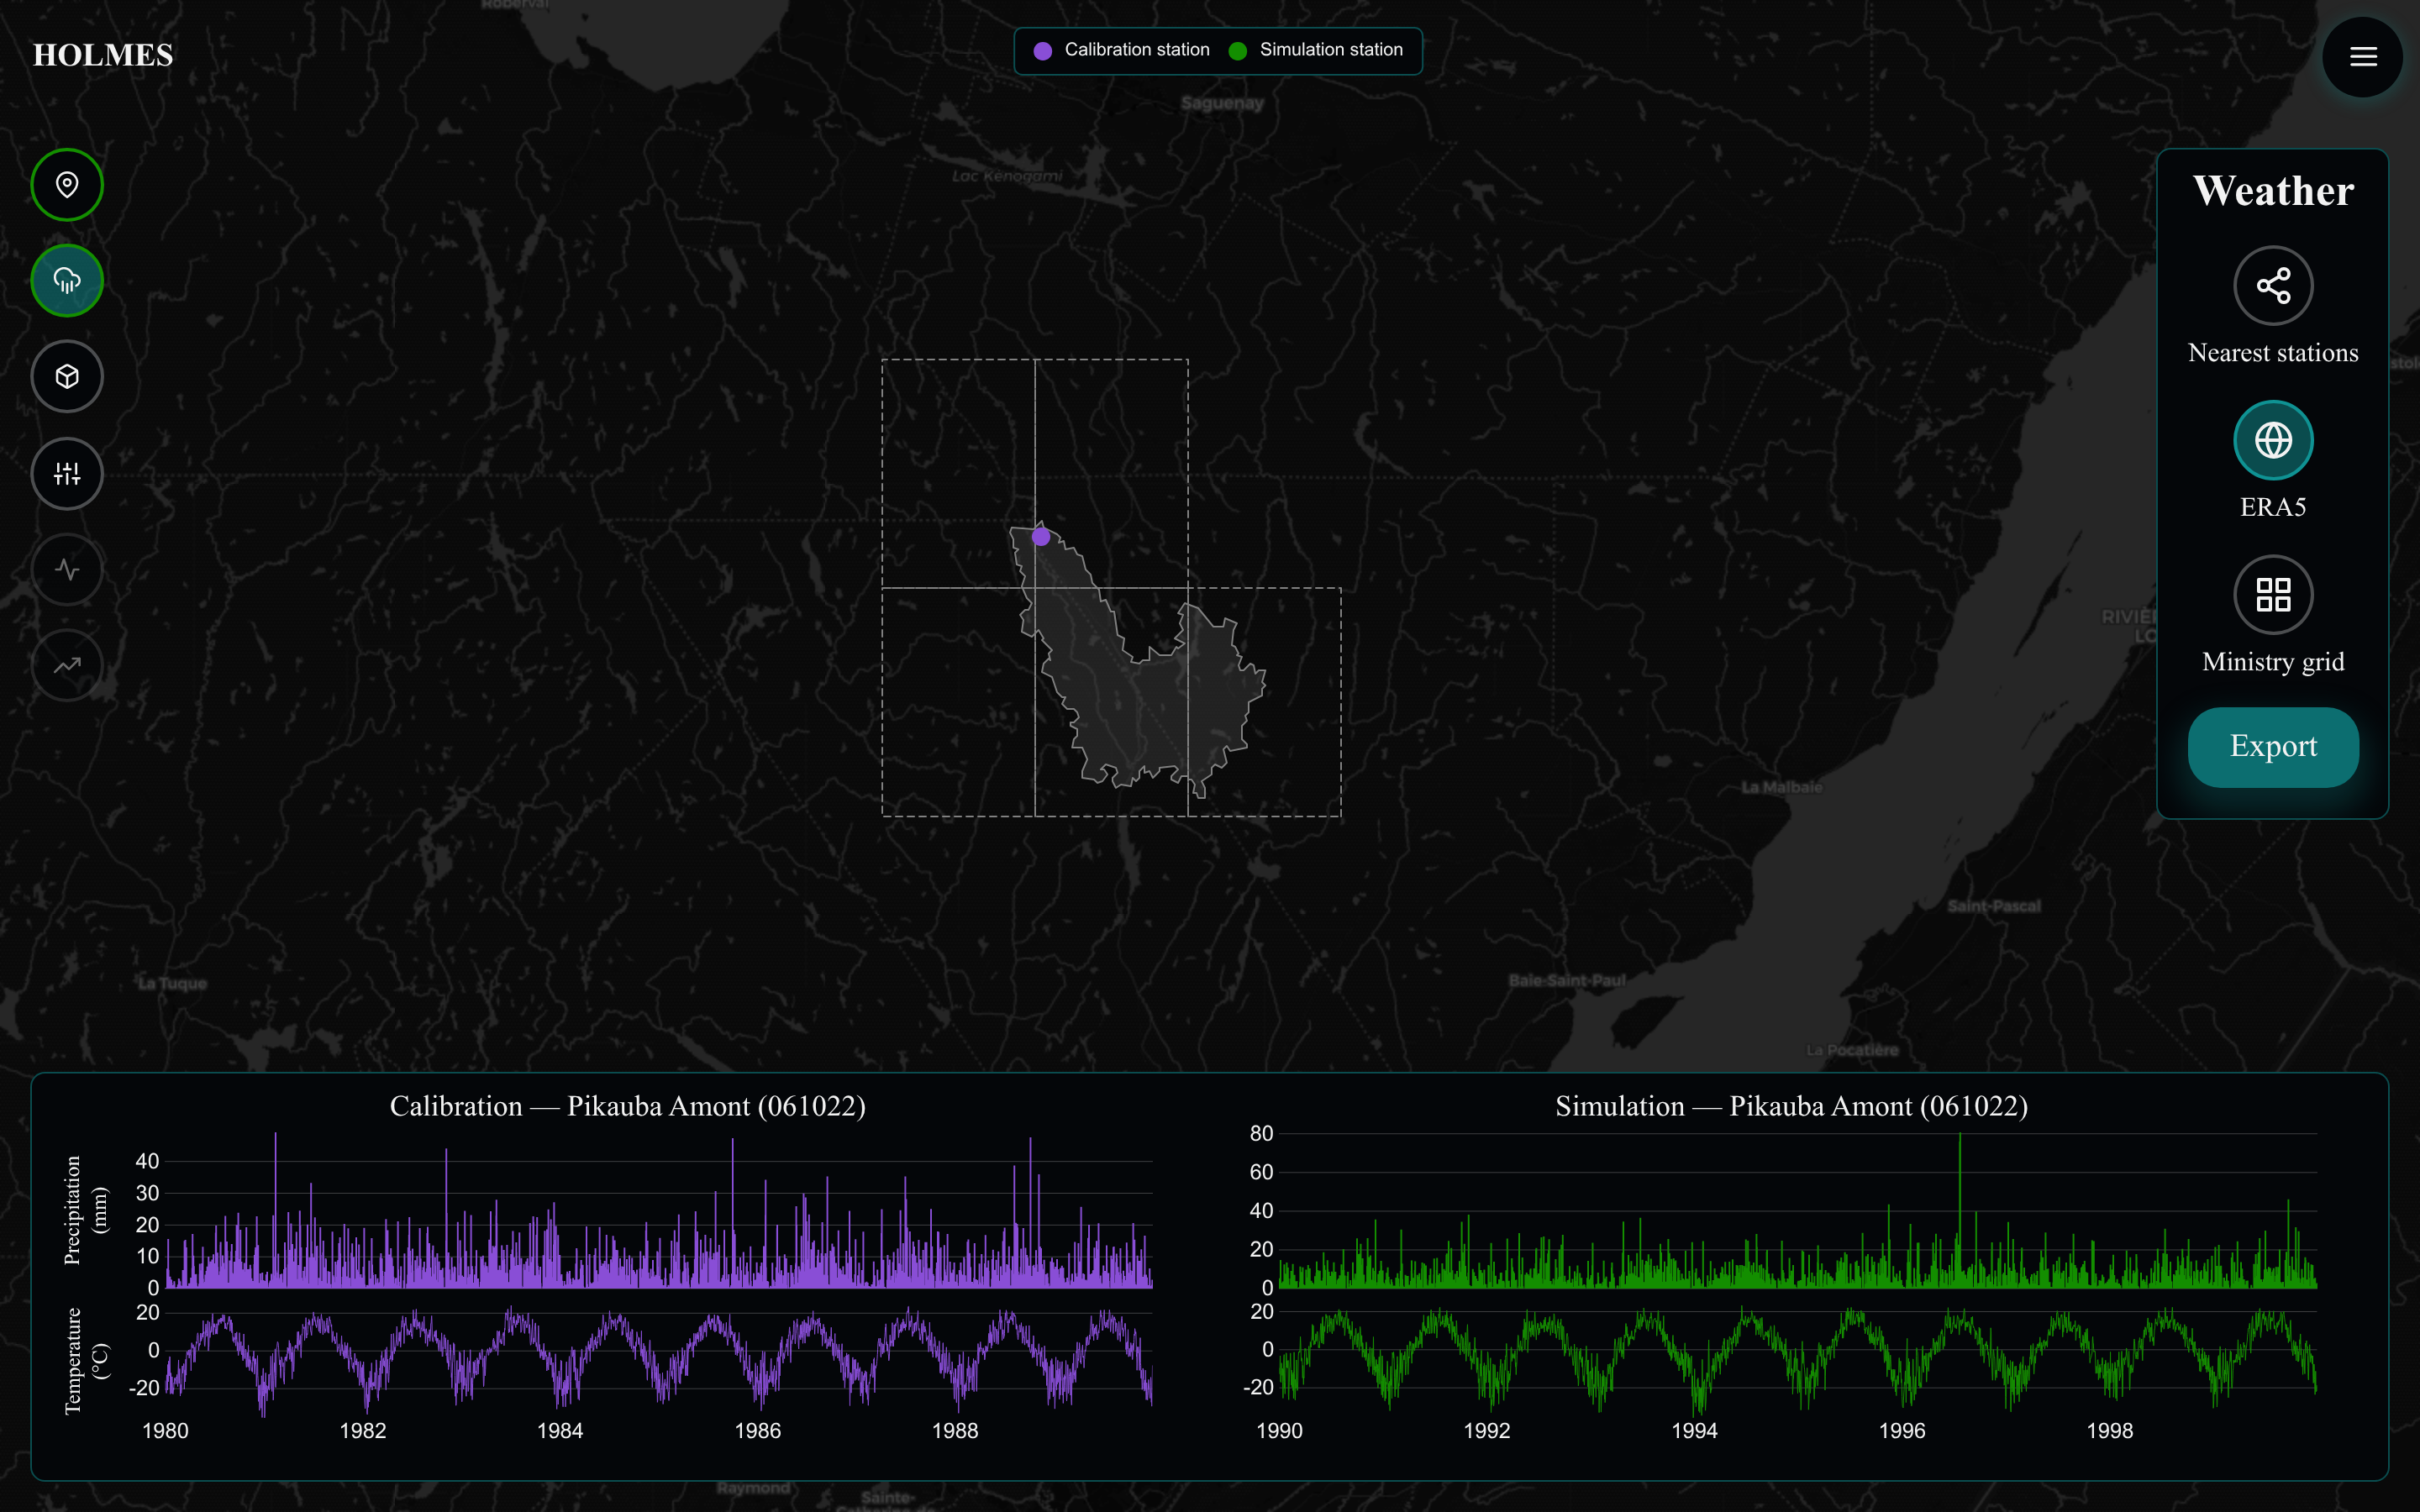
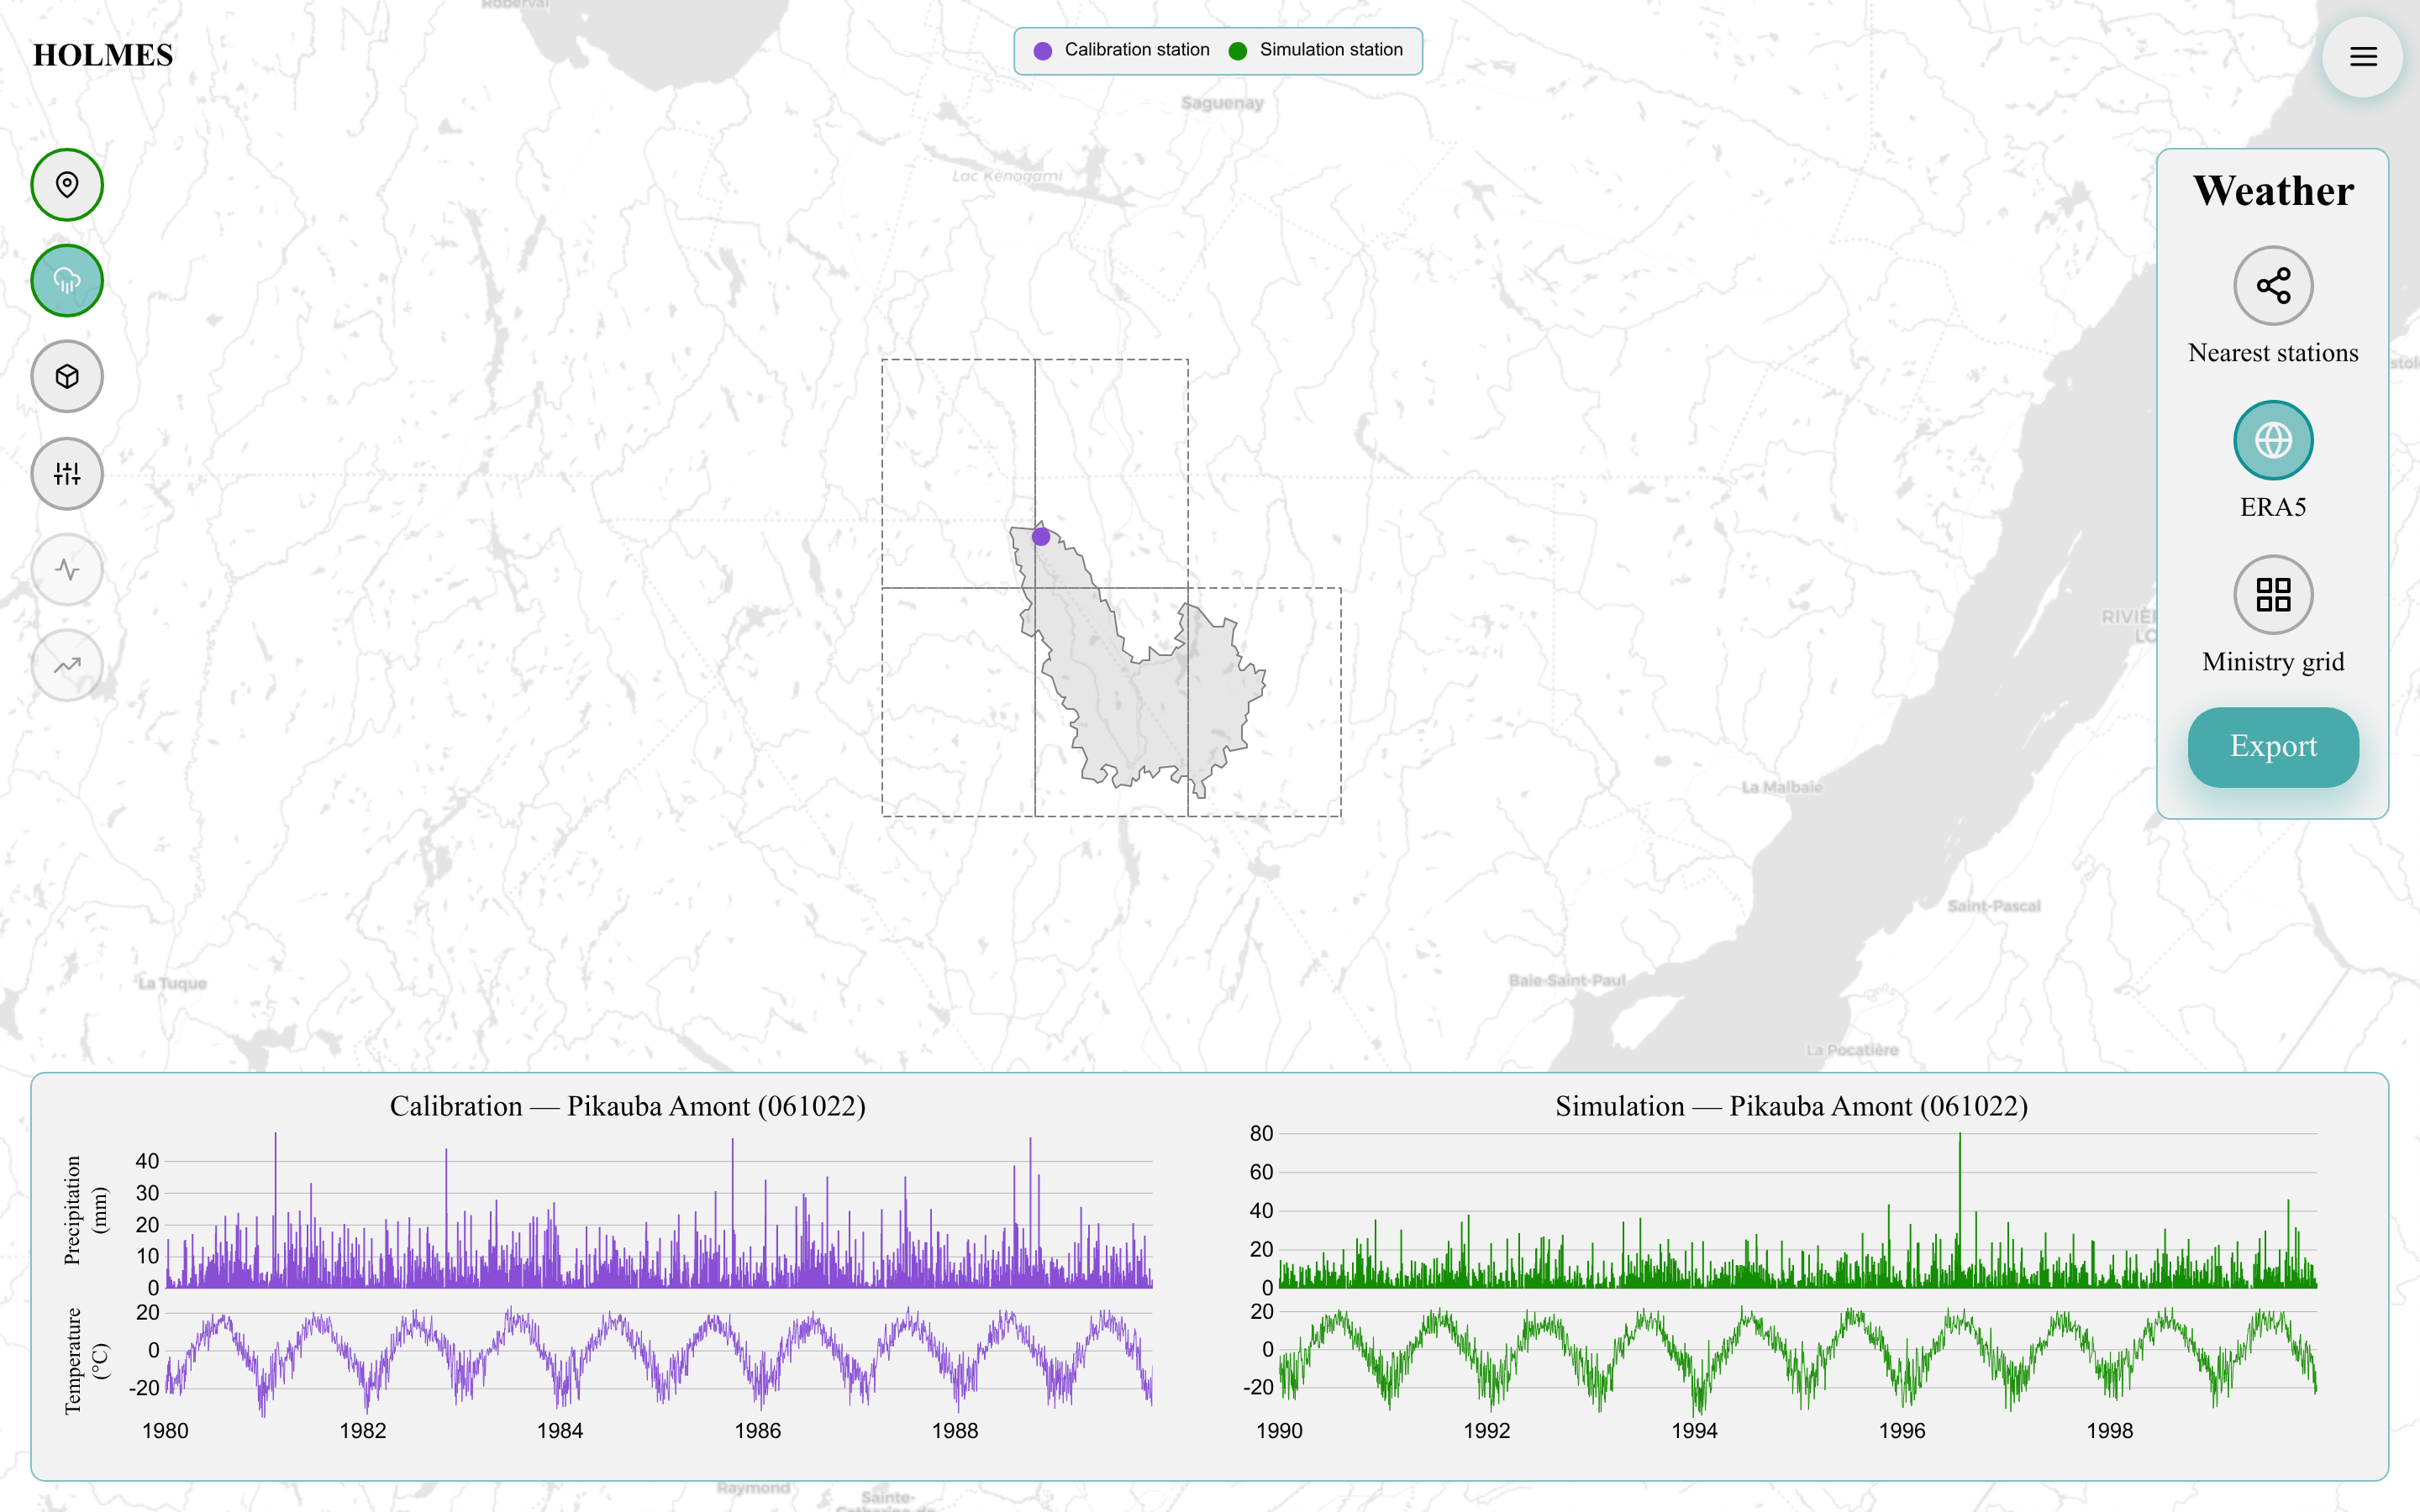
The ECMWF ERA5 global reanalysis: a model-based reconstruction of past weather on a 0.25° grid, extracted at the grid cells covering each watershed and averaged with area weights. The map outlines the contributing cells.
"Ministry grid"
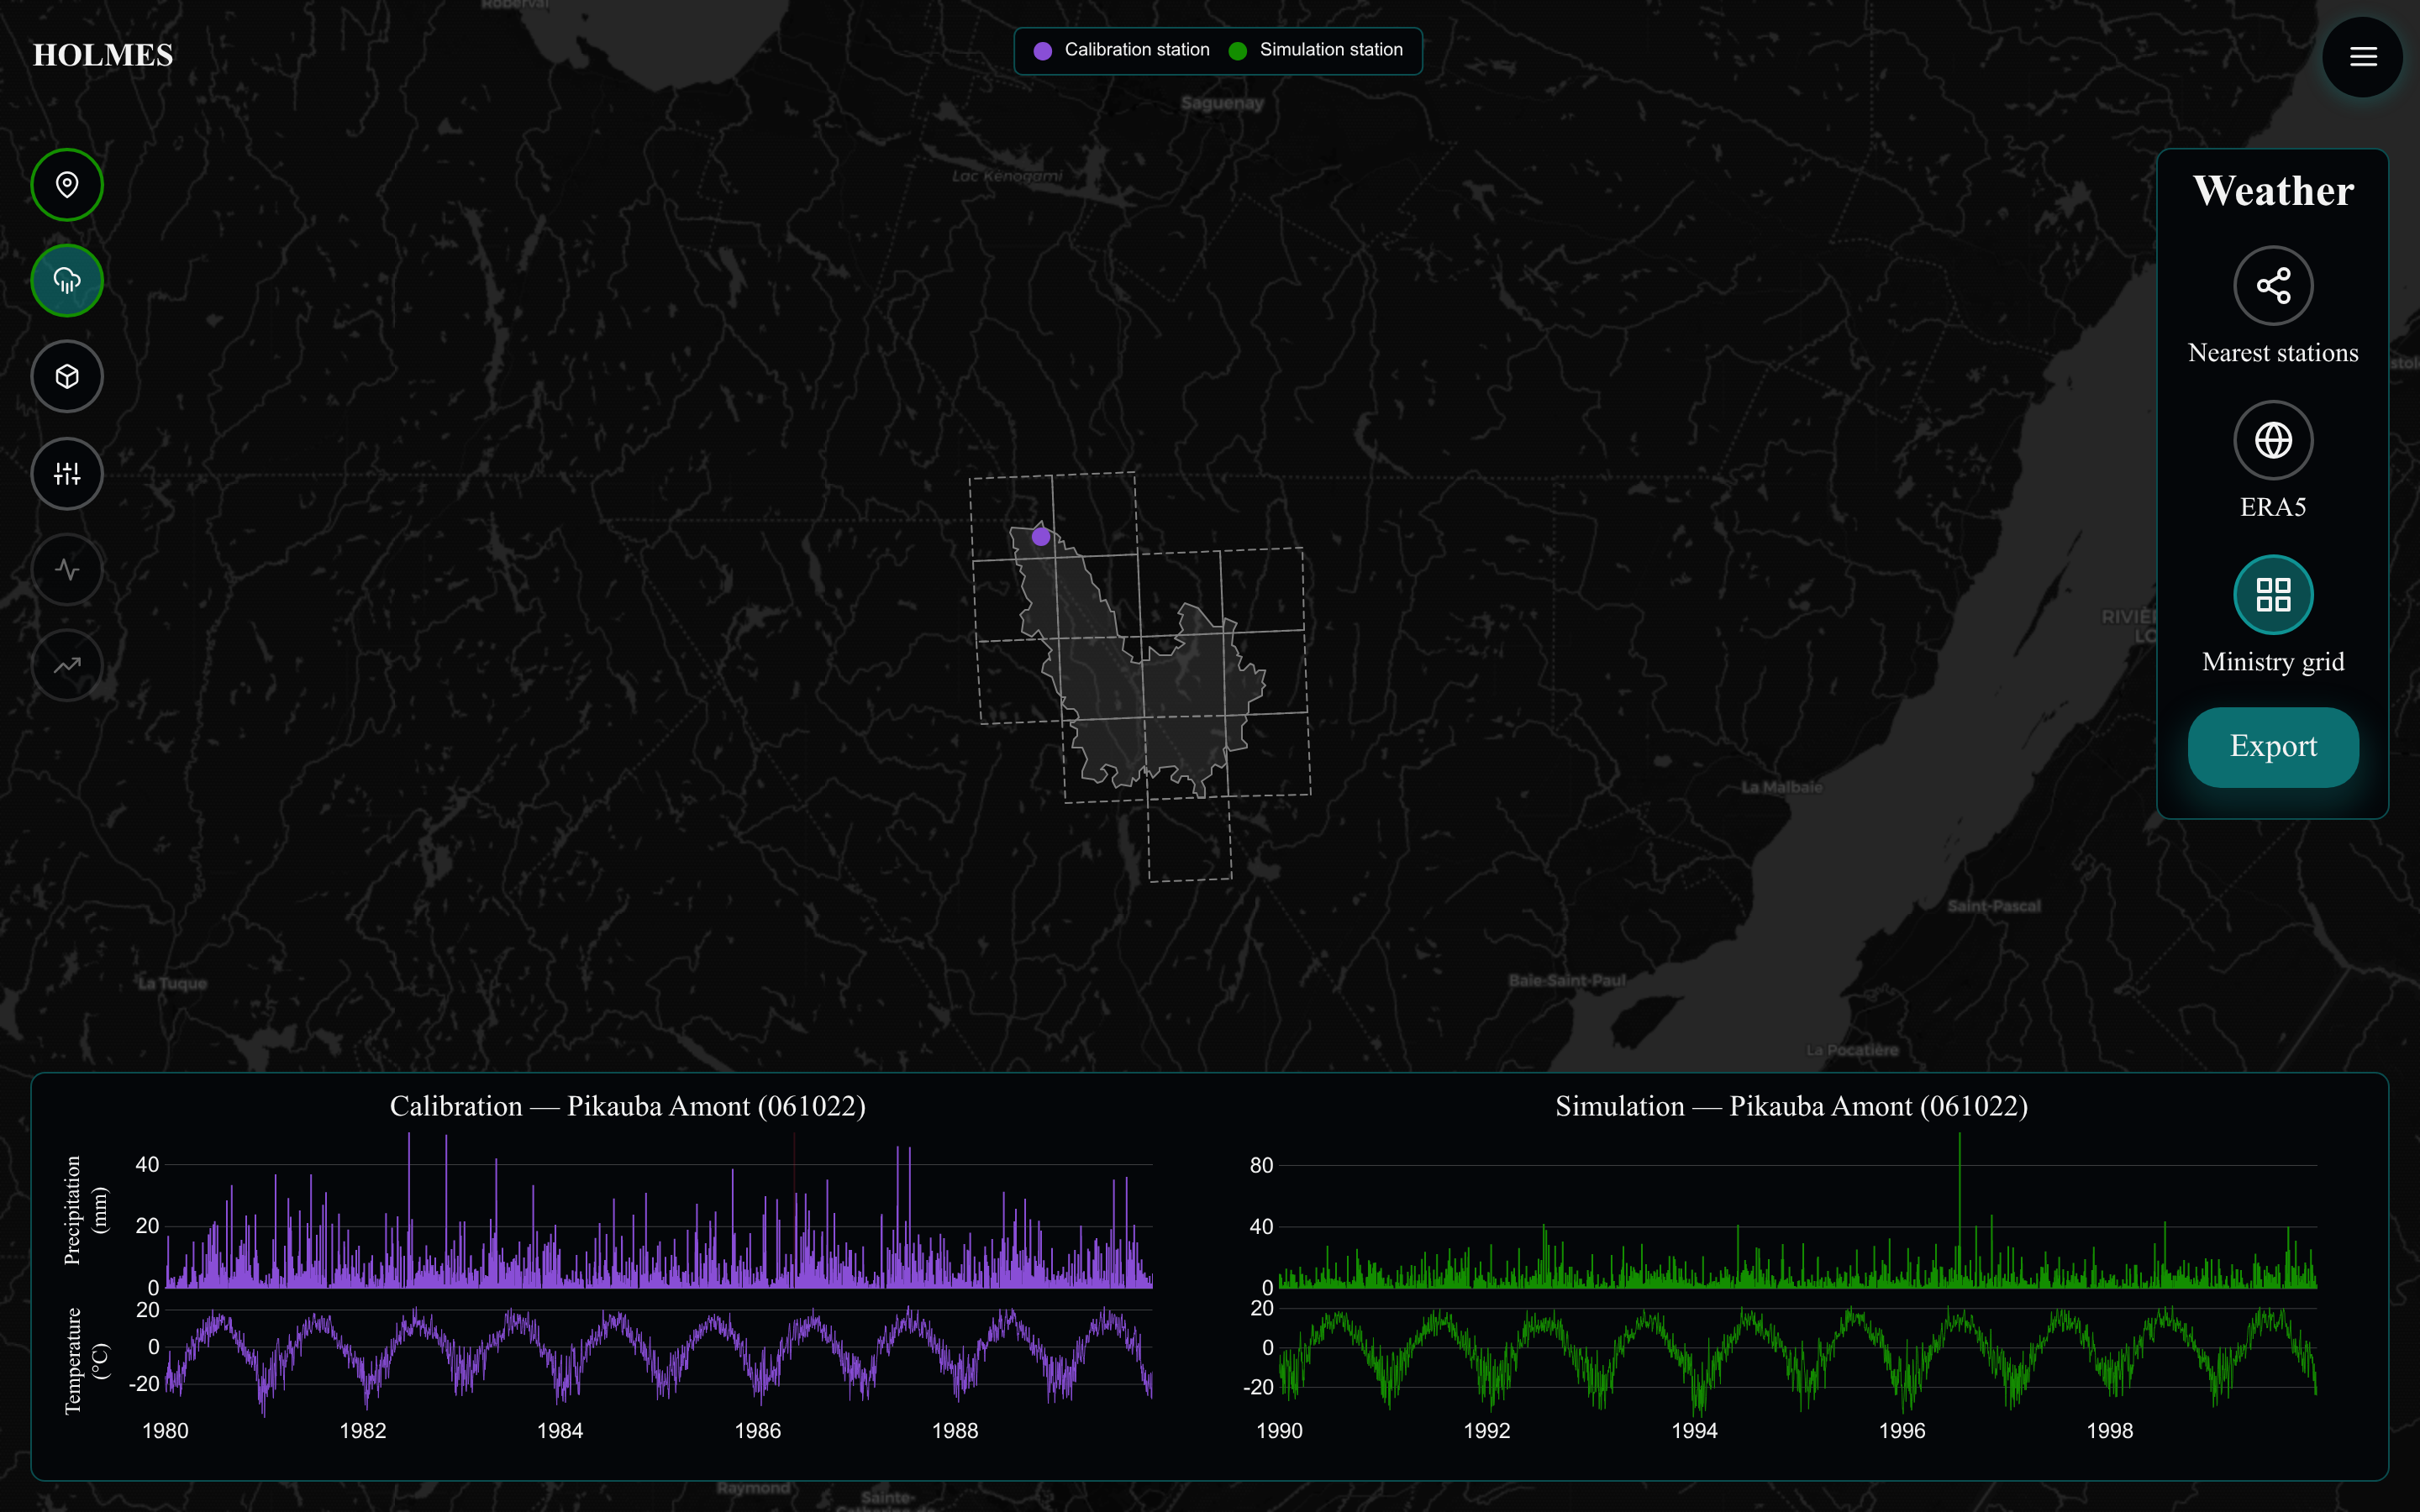
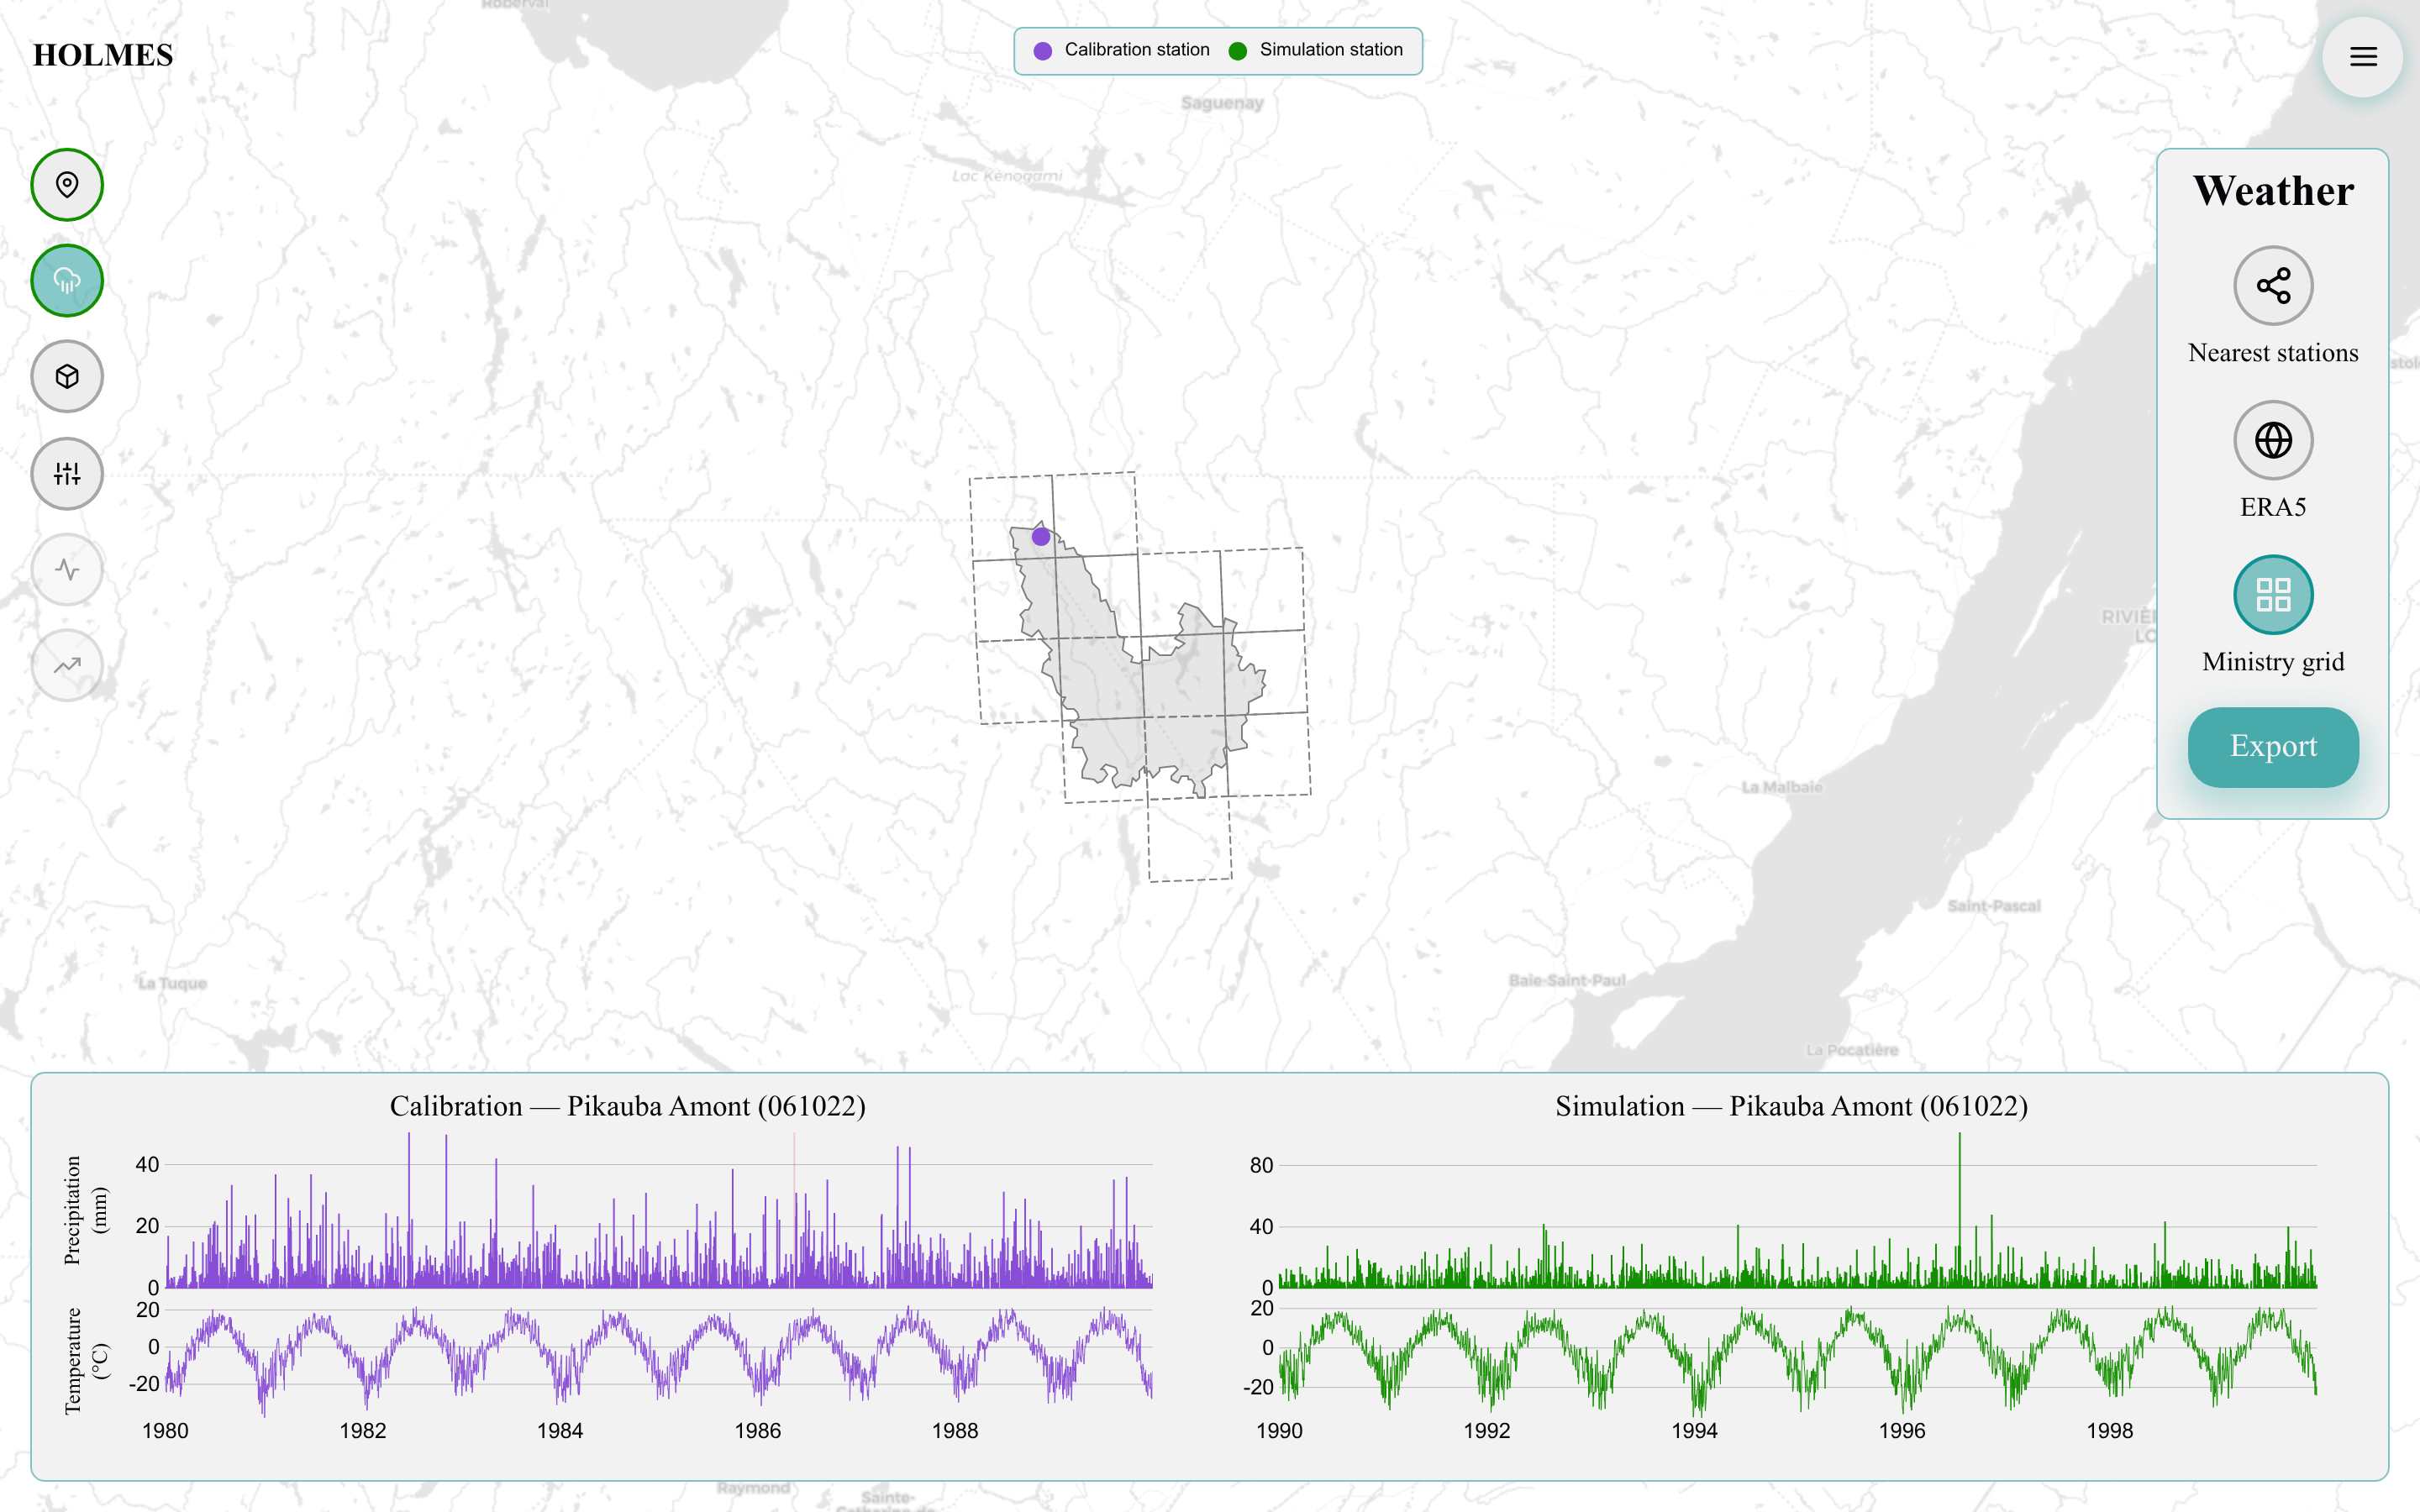
The Grilles climatiques du Québec daily grids: spatially interpolated station observations on a fine grid, reduced to an area-weighted watershed mean.
Charts
The canvas shows four charts: precipitation (mm, daily bars, top) and temperature (°C, line, bottom), for the calibration watershed (purple, left) and the simulation watershed (green, right), each over its own period.
Export
"Export" downloads one CSV per role (weather_<method>_<role>_<id>.csv, columns datetime,precipitation,temperature), enabled once the current method's data is loaded.