User Guide
This guide provides comprehensive documentation for using the HOLMES web interface. Whether you're a student learning about hydrological modeling or an instructor teaching operational hydrology, this guide will help you make the most of HOLMES.
Overview
HOLMES provides three main workflows, each accessible from the navigation menu:
| Workflow | Purpose | Prerequisites |
|---|---|---|
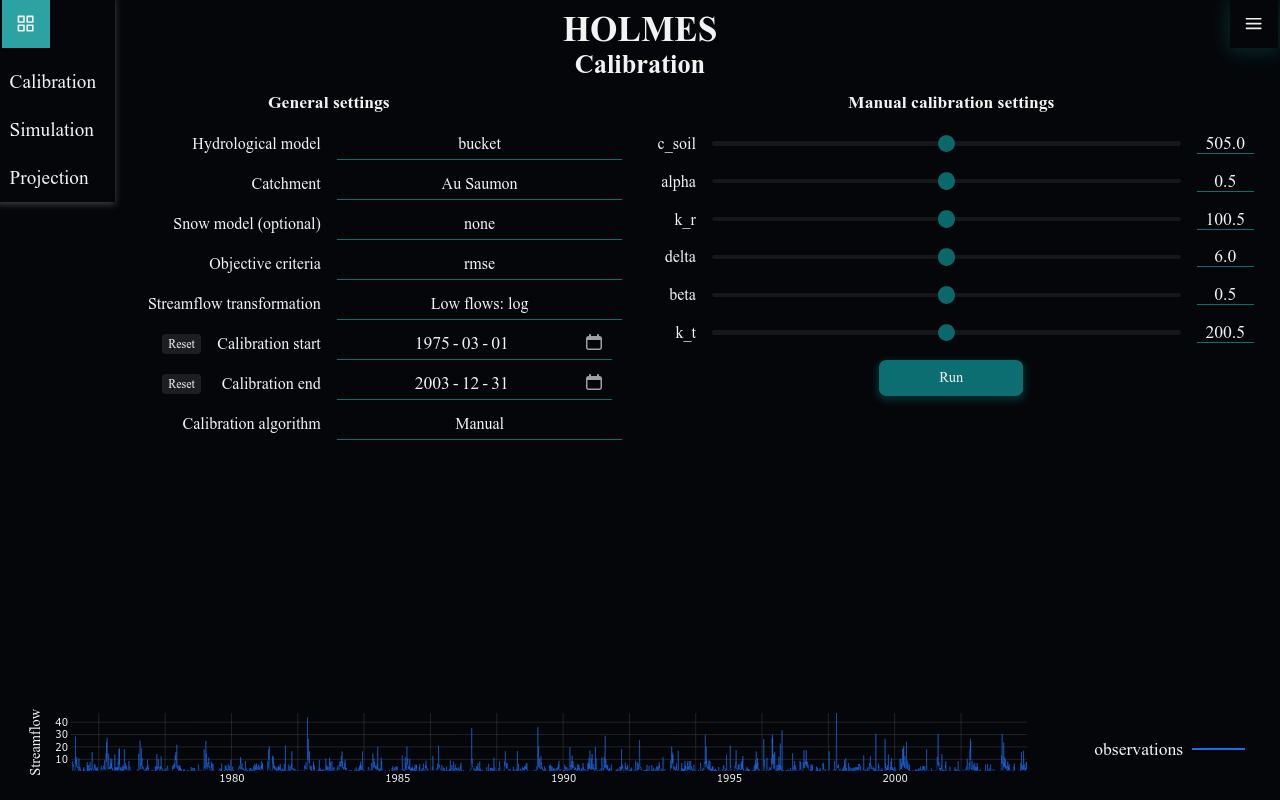
| Calibration | Find optimal model parameters by fitting to observed data | Catchment data |
| Simulation | Run the model with calibrated parameters on any time period | Calibrated parameters |
| Projection | Explore future streamflow under climate change scenarios | Calibrated parameters + Climate data |
Interface Structure
The HOLMES interface consists of:
- Navigation Menu (top left corner) - Switch between Calibration, Simulation, and Projection
- Settings Menu (top right corner) - Theme toggle, data persistence, version info
- Configuration Panel (top) - Model and run settings
- Results Panel (bottom) - Charts and metrics
Typical Workflow
A typical HOLMES session follows this pattern:
- Calibrate a model against observed streamflow data
- Export the calibrated parameters to a JSON file
- Simulate streamflow for validation periods or other catchments
- Project future conditions using climate model data
Quick Links
By Task
- Run my first calibration
- Use automatic optimization
- Compare multiple models
- Explore climate projections
- Export my results
- Change the theme
By Feature
- Understanding parameter sliders
- Interpreting performance metrics
- Zoom and pan on charts
- Save my settings between sessions
User Guide Sections
-
Learn the common UI elements: navigation, charts, forms, and keyboard shortcuts
-
Manual and automatic model calibration against observed data
-
Forward model runs with calibrated parameters
-
Climate change impact assessment
-
Theme, data persistence, and other preferences