Interface Overview
This page describes the common elements of the HOLMES interface that appear across all pages.
Navigation
The navigation menu is accessed by clicking the grid icon in the top-left corner. It provides access to the three main pages:
| Page | Description |
|---|---|
| Calibration | Fit model parameters to observed streamflow |
| Simulation | Run forward simulations with calibrated parameters |
| Projection | Explore climate change scenarios |
Click any page name to navigate there. Your current settings and data are preserved when switching pages (if Allow save is enabled in settings).
Page Layout
Each page follows a consistent vertical layout, with sections flowing from top to bottom:
Header
The top area contains:
- Navigation menu (grid icon, top-left)
- Settings menu (hamburger icon, top-right)
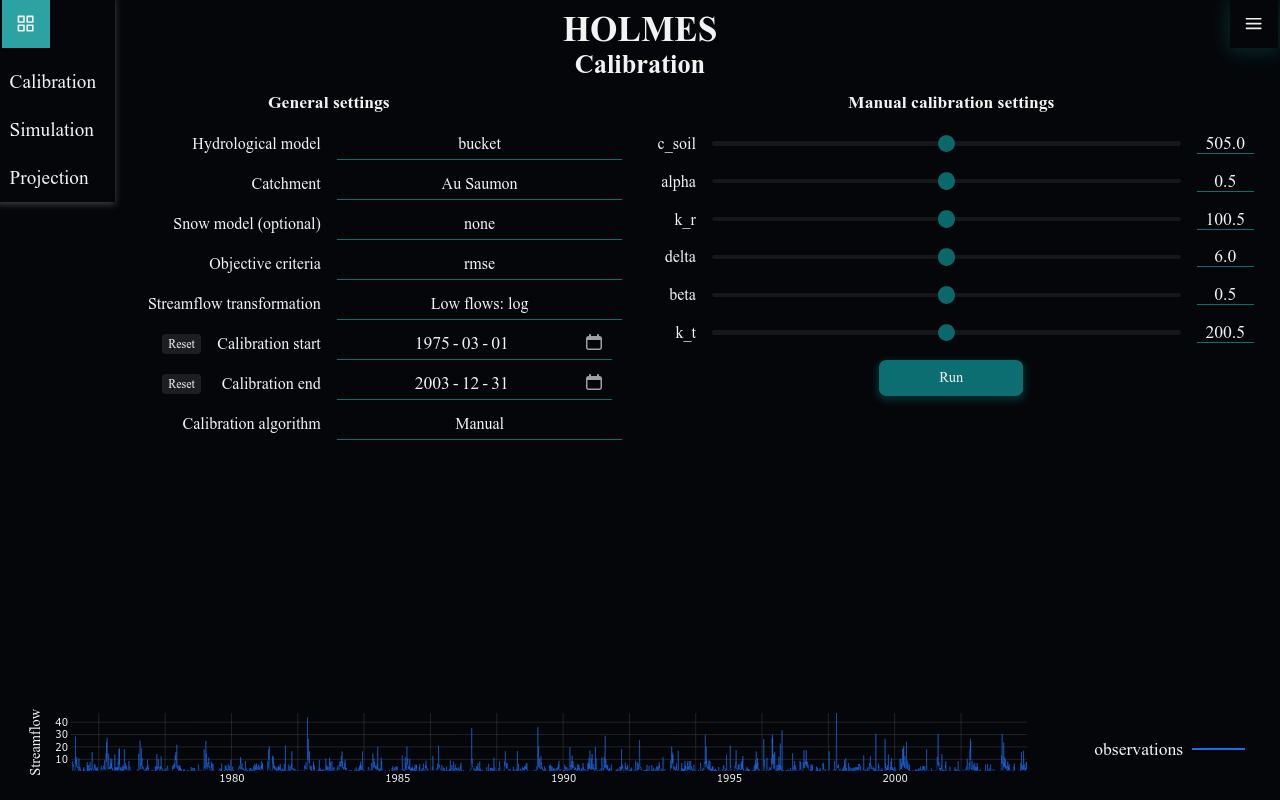
Configuration Section
Below the header, configuration options appear:
- Form fields for selecting models, catchments, dates
- Parameter controls (sliders for manual calibration, inputs for algorithms)
- Action buttons (Run, Start, Stop, Export)
Results Section
Below the configuration, results are displayed:
- Time series charts showing observed and simulated streamflow
- Parameter evolution plots during calibration
- Performance metrics (NSE, KGE, etc.)
Form Elements
Dropdowns
Select from predefined options:
- Hydrological model: Choose which model to use
- Catchment: Select the dataset
- Objective criteria: Choose the performance metric
Date Inputs
Set calibration/simulation periods:
- Click the field to open a date picker
- Use the Reset button to return to the full available range
- Dates are constrained to the catchment's data availability
Parameter Sliders
In manual calibration mode, sliders control model parameters:
- Drag the slider to adjust values
- The numeric input shows the current value
- Values are constrained between model-defined bounds
Checkboxes
Toggle options on/off:
- Multimodel simulation: Average multiple calibrations (Simulation page)
- Allow save: Persist settings between sessions (Settings)
Charts
All charts in HOLMES share common interaction patterns.
Chart Interactions
Zooming
Zoom into a specific time period:
- Click and drag horizontally to select a region
- Release to zoom to that selection
- Double-click anywhere to reset to the full view
Reading Values
Hover over chart elements to see values. The legend identifies each line:
- Observations: Measured streamflow (blue)
- Simulation: Model output (green)
- Warmup period: Initial period excluded from metrics (blue shaded area)
Chart Types
| Chart | Description | Found on |
|---|---|---|
| Streamflow time series | Observed vs simulated streamflow | Calibration, Simulation |
| Parameter evolution | How parameters change during optimization | Calibration (automatic) |
| Objective function | Performance metric improvement over iterations | Calibration (automatic) |
| Bar charts | Performance metrics comparison | Simulation |
| Seasonal projection | Daily mean streamflow by month | Projection |
Notifications
HOLMES displays notifications at the top-center of the page:
- Success messages: Operation completed (default background)
- Error messages: Something went wrong (red/emphasized)
Notifications automatically dismiss after a few seconds. Errors provide guidance on how to resolve the issue.
Loading States
When HOLMES is processing:
- A loading indicator appears during data fetches and model runs
- Buttons may be disabled to prevent conflicting operations
- During automatic calibration, the Stop button replaces Start
Connection Status
HOLMES uses WebSocket connections for real-time updates. If the connection is lost:
- HOLMES attempts to reconnect automatically
- If reconnection fails repeatedly, a notification advises refreshing the page
- Your local settings (if Allow save is enabled) are preserved in browser storage
Keyboard Shortcuts
| Shortcut | Action |
|---|---|
| T | Toggle theme (light/dark) |
Browser Compatibility
HOLMES works best with:
- Chrome/Edge (latest)
- Firefox (latest)
- Safari (latest)
JavaScript must be enabled for the application to function.
Tips
Data Persistence
Enable Allow save in settings to remember your configuration between browser sessions. This is especially useful when working on the same catchment over multiple sessions.
Multiple Tabs
You can open HOLMES in multiple browser tabs to compare different configurations side-by-side. Note that tabs share the same localStorage, so changes in one tab may affect others after page refresh. Disable Allow save in settings to prevent this.