Projection
The Projection page explores how streamflow might change under future climate scenarios. Using calibrated model parameters and climate model projections, you can assess potential impacts of climate change on water resources.
Overview
Climate projection simulates streamflow using:
- Calibrated model parameters from the Calibration page
- Future climate data from climate projections
Results show potential changes in streamflow seasonality and magnitude under different climate scenarios and time horizons.
Prerequisites
Before using projections, you need:
- Calibrated parameters: Export from the Calibration page
- Projection data: Climate projections for your catchment (pre-loaded in HOLMES)
Projection Data Availability
Projection data is catchment-specific. Not all catchments have projection data available.
Importing Calibration Results
Step 1: Prepare Calibration
- Go to the Calibration page
- Calibrate a model for your catchment
- Click Export parameters to save the JSON file
Step 2: Import to Projection
On the Projection page:
- Click Import model parameters
- Select your calibration JSON file
- The calibration details appear in the table
Single Calibration
Unlike Simulation, the Projection page uses only one calibration at a time. Importing a new calibration replaces the existing one.
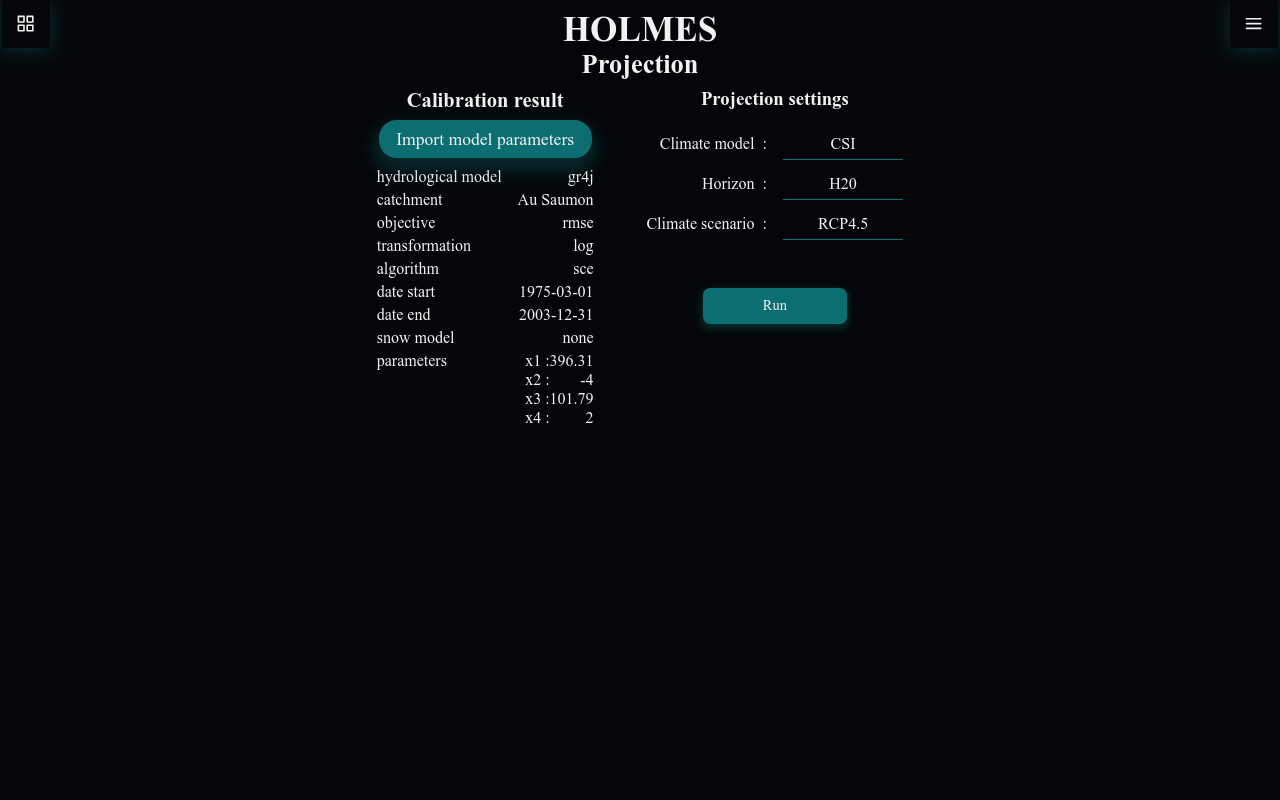
Calibration Results Table
The table displays the imported calibration:
| Field | Description |
|---|---|
| hydrological model | GR4J, Bucket, etc. |
| catchment | Must match available projection data |
| objective | Calibration objective used |
| transformation | Streamflow transformation |
| algorithm | Manual or SCE |
| date start | Calibration period start |
| date end | Calibration period end |
| snow model | CemaNeige or none |
| parameters | Calibrated parameter values |
Projection Settings
After importing a calibration, configure the projection:
Climate Model
Select the climate model that provides future climate data:
- Different models have different assumptions and biases
- Multiple models allow uncertainty assessment
Horizon
Select the future time period. Available horizons depend on the projection data for your catchment (e.g., H20, H50, H80).
Climate Scenario
Select the climate scenario. Available scenarios depend on the projection data for your catchment (e.g., RCP4.5, RCP8.5, REF).
Running a Projection
- Import a calibration result
- Select climate model, horizon, and scenario
- Click Run
A loading indicator shows while the projection runs (this may take longer than calibration/simulation due to the longer time series).
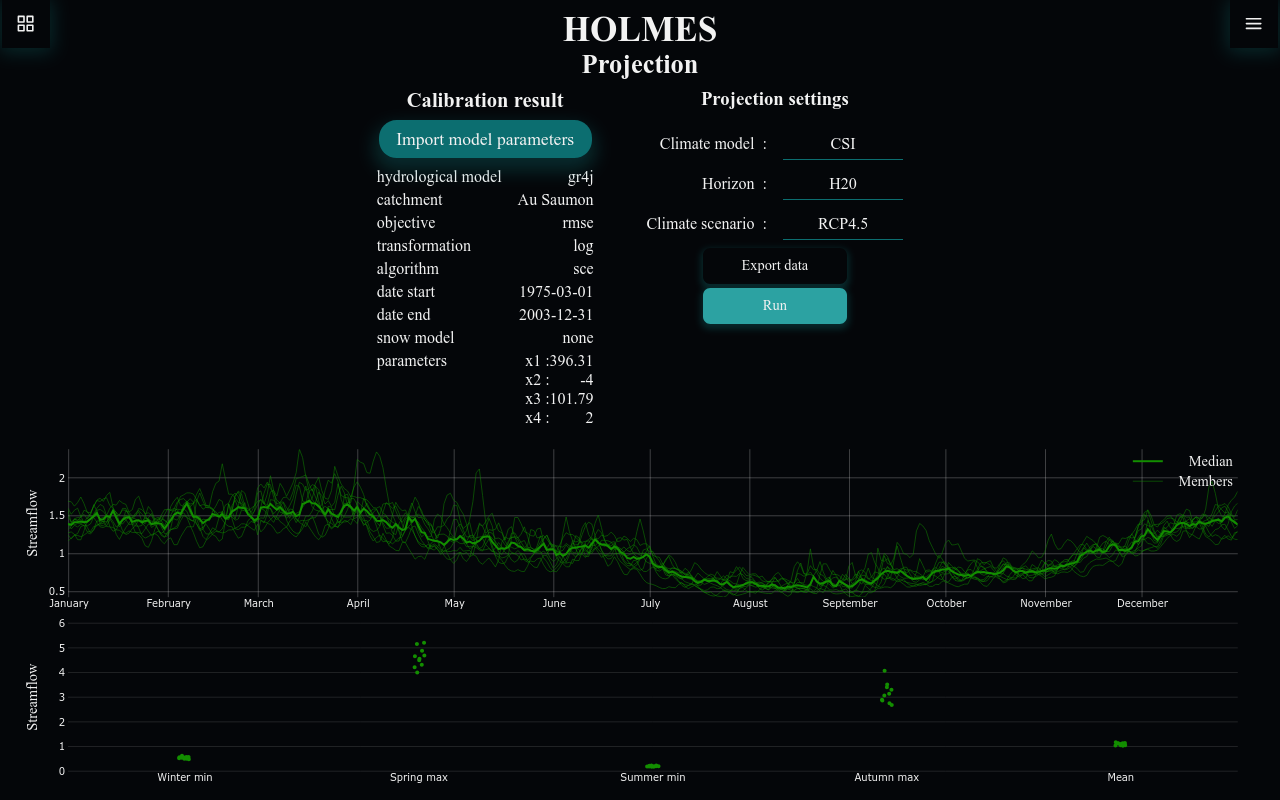
Understanding Results
Projection Chart
The main chart shows the mean daily hydrograph (averaged across all years in the projection period):
- X-axis: Month (January to December)
- Y-axis: Streamflow
- Light lines: Individual ensemble members
- Bold line: Median across all members
This shows the expected seasonal pattern of streamflow under the selected scenario.
Chart Interactions
- Zoom: Click and drag to select a time range
- Reset: Double-click to return to full year view
Results Chart
The dot plot shows summary statistics for each ensemble member:
| Metric | Description |
|---|---|
| Winter min | Minimum daily flow in January-March |
| Spring max | Maximum daily flow in March-June |
| Summer min | Minimum daily flow in May-October |
| Autumn max | Maximum daily flow in September-December |
| Mean | Annual mean streamflow |
Each dot represents one ensemble member, showing the spread of projections.
Interpreting Projections
Ensemble Spread
The spread of ensemble members indicates uncertainty:
- Narrow spread: Models agree on the projection
- Wide spread: Significant uncertainty in the projection
Seasonal Changes
Look for changes in:
- Peak timing: Has the spring freshet shifted earlier/later?
- Peak magnitude: Are floods projected to increase/decrease?
- Low flow timing: When do minimum flows occur?
- Low flow magnitude: Are droughts projected to worsen?
Comparing Scenarios
Run projections with different settings to understand:
- Horizon effect: How do projections change across different time horizons?
- Scenario effect: How do different climate scenarios compare?
- Model effect: Do different climate models agree?
Exporting Results
Click Export data to save:
-
Projection timeseries (CSV): Daily mean streamflow by day of year
-
Projection results (CSV): Summary statistics per member
Common Issues
No Projection Data
If the projection settings don't appear after importing calibration:
- The catchment may not have projection data available
- Try a different catchment with projection data
Long Run Times
Projections can take longer than calibration:
- Climate model data spans many years
- Multiple ensemble members are processed
- Wait for the loading indicator to complete
Unexpected Results
If projections seem unrealistic:
- Verify calibration quality first
- Check that the correct catchment was calibrated
- Consider if the model is appropriate for future conditions